本編ではシングルセル解析初心者の方がテストデータを用いて、 一通りのデータ解析が行えるようになることを目的としています。
ここでは、前回のシングルセル解析入門で解析したscRNA-seq/scATAC-seq結果を 用いてRモジュールのSeura(スーラ)、Signac(シニャック)を用いてさらに詳細な解析を行う方法を解説します。
作業の準備
$ #作業ディレクトリを作成してその中で作業を行うことにします
$ mkdir ~/work/
$ cd ~/work/
Rのインストール
$ echo -e "\n## For R package"  | sudo tee -a /etc/apt/sources.list
$ echo "deb https://cran.rstudio.com/bin/linux/ubuntu $(lsb_release -cs)-cran40/" | sudo tee -a /etc/apt/sources.list
$
$ #行末に以下が追加されていました
$ cat /etc/apt/sources.list
...
...
## For R package
deb https://cran.rstudio.com/bin/linux/ubuntu focal-cran40/

$ #ダウンロード元の公開鍵を取得して、aptに登録
$ gpg --keyserver hkp://keyserver.ubuntu.com:80 --recv-keys E298A3A825C0D65DFD57CBB651716619E084DAB9
gpg: /home/XXXXX/.gnupg/trustdb.gpg: trustdb created
gpg: key 51716619E084DAB9: public key "Michael Rutter " imported
gpg: Total number processed: 1
gpg:               imported: 1
$ gpg -a --export E298A3A825C0D65DFD57CBB651716619E084DAB9 | sudo apt-key add -
OK
$ sudo apt-get update
$ sudo apt update
...
$ #インストールの確認がありますので"Y"を入力します。
$ sudo apt install r-base
...
...
$ #インストールが完了したらRのバージョンを確認しましょう。私の環境Windows10 WSL2では以下のようになりました(2020/09/24現在)
$ R --version
R version 4.0.2 (2020-06-22) -- "Taking Off Again"
Copyright (C) 2020 The R Foundation for Statistical Computing
Platform: x86_64-pc-linux-gnu (64-bit)

R is free software and comes with ABSOLUTELY NO WARRANTY.
You are welcome to redistribute it under the terms of the
GNU General Public License versions 2 or 3.
For more information about these matters see
https://www.gnu.org/licenses/.
$
解析準備(Rパッケージのインストールに必要なライブラリのインストール)
WSL2にインストールする場合
$ sudo apt-get install libcurl4-openssl-dev
...
$ sudo apt-get install libssl-dev
...
$ sudo apt-get install libxml2-dev
...
$ sudo apt-get install libhdf5-dev
...
$
$ sudo dnf -y install libcurl-devel
...
$ sudo dnf -y install openssl-devel
...
$ sudo dnf -y install libxml2-devel
...
$ sudo dnf -y install hdf5-devel
...
$ sudo dnf -y install libjpeg-turbo-devel
...
$
解析準備(Rパッケージのインストール)
まずSeuratをインストールします。
scRNA-seqの解析パッケージ。とてもよく使用されています。
Stuart et al. 2019 Cell
$ # Rのコンソールに入る
$ R
> # scRNAの解析に必要なツール(Seurat v3.2.1)をインストール
> install.packages('Seurat') #v3.2.1がインストールされる(201912現在)。Rをローカルユーザで実行しているため、ローカルのディレクトリにインストールするか尋ねられますがyesを選択しましょう。時間が掛かります。
> install.packages('dplyr')
> #Rを終了する
> q()
$
次にSignacをインストールします。
scATAC-seqの解析パッケージです。
$ # Rのコンソールに入る
$ R
> # scATACの解析に必要なツール(Signac v1.0.0)をインストール
> if (!requireNamespace("BiocManager", quietly = TRUE)) install.packages("BiocManager")
> BiocManager::install()
> setRepositories(ind=1:2)
> install.packages("Signac")
> #install.packages("devtools")
> #devtools::install_github("timoast/signac") #v1.0.0; 20200924現在
> #Rを終了する
> q()
$
Signacのインストールでエラーが出た場合、必要に応じて下記の依存パッケージをインストールしてから再度チャレンジしてください。
> # GenomeInfoDbData
> BiocManager::install("GenomeInfoDbData")
> # GO.db
> BiocManager::install("GO.db")
> # XVector
> BiocManager::install("XVector")
> # GenomicRanges
> BiocManager::install("GenomicRanges")
> # GenomicAlignments
> BiocManager::install("GenomicAlignments")
> # rtracklayer
> BiocManager::install("rtracklayer")
> # hdf5r
> BiocManager::install("hdf5r")
> # biovizBase
> BiocManager::install("biovizBase")
> # ggbio
> BiocManager::install("ggbio")
> # AnnotationFilter
> BiocManager::install("AnnotationFilter")
> # 環境によってはさらに別のパッケージのインストールが必要かもしれません
> install.packages("Signac")
$ R
> # Seurat
> packageVersion("Seurat")
[1] ‘3.2.2’
> # Signac
> packageVersion("Signac")
[1] ‘1.0.0’
> q()
$
Seuratを使ったscRNA-seq解析
データの確認と解析準備
$ mkdir ~/analysis_scRNA/Seurat
$ cd ~/analysis_scRNA/Seurat #適当な解析ディレクトリを作成し移動
$ R
> #解析スタート
> library(Seurat)
> library(dplyr)
> set.seed(1234)
> lung.data <- Read10X(data.dir = "~/analysis_scRNA/emm_rnaseq/outs/filtered_feature_bc_matrix")
> 3細胞以上で検出できた遺伝子を使用し、200以上のUMIを持つ細胞を使用
> lung <- CreateSeuratObject(counts = lung.data, project = "lung", min.cells = 3, min.features = 200)
ミトコンドリアリードの確認(QC)
> lung[["percent.mt"]] <- PercentageFeatureSet(lung, pattern = "^mt-")
> #metadataの確認
> head(lung@meta.data)
                   orig.ident nCount_RNA nFeature_RNA percent.mt
AAACCCAAGCCTAGGA-1       lung      11245         3313   3.112494
AAACCCAAGGTGCTAG-1       lung        431          259  12.296984
AAACCCACAAGGATGC-1       lung      14923         4079   2.579910
AAACCCACAATTCGTG-1       lung      11329         3554   4.060376
AAACCCACACGAGGTA-1       lung       3779         1591   5.054247
AAACCCACAGAAGCTG-1       lung      11357         3619   2.694374
> #細胞数の確認
> length(lung@meta.data$nFeature_RNA)
[1] 10724
フィルタリング
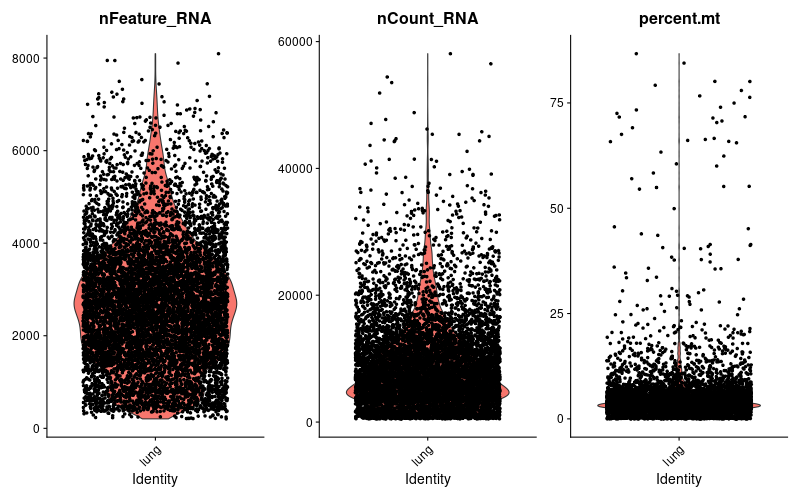
> #遺伝子数、UMI数。ミトコンドリアリードの割合の分布を出力
> png("VlnPlot_QC.png", width = 800, height = 500)
> #nFeature_RNA: 検出遺伝子数, nCount_RNA: UMIの数, percent.mt: ミトコンドリアの割合
> VlnPlot(lung, features=c("nFeature_RNA", "nCount_RNA", "percent.mt"), ncol = 3)
> dev.off()
> png("FeatureScatter.png", width = 800, height = 500)
> plot1 <- FeatureScatter(lung, feature1 = "nCount_RNA", feature2 = "percent.mt")
> plot2 <- FeatureScatter(lung, feature1 = "nCount_RNA", feature2 = "nFeature_RNA")
> CombinePlots(plots = list(plot1, plot2))
> dev.off()
|

|
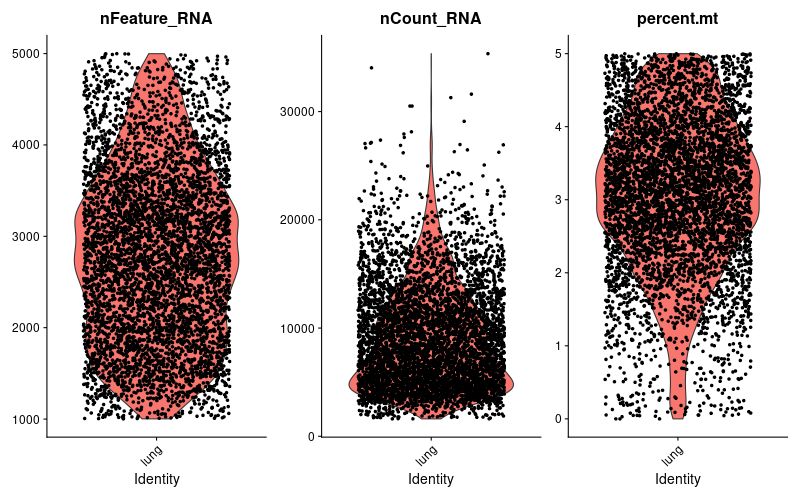
> #検出遺伝子数1000以上、5000以下、ミトコンドリア5%以下でフィルタリング (ここの値をどうするかが重要!)
> lung <- subset(lung , subset = nFeature_RNA > 1000 & nFeature_RNA < 5000 & percent.mt < 5)
> #検出遺伝子数およびUMI数が多い細胞はマルチプレットの可能性が高く除外する
> #ミトコンドリアは5-10%以下とすることが多い。細胞種によって異なるので、分布をきちんと確認し適切な閾値を設置する
> #細胞数の確認
> length(lung@meta.data$nFeature_RNA)
[1] 5150
> #細胞フィルタリング後のQCプロットを出力
> png("VlnPlot_QC_subset.png", width = 800, height = 500)
> #nFeature_RNA: 検出遺伝子数, nCount_RNA: UMIの数, percent.mt: ミトコンドリアの割合
> VlnPlot(lung, features=c("nFeature_RNA", "nCount_RNA", "percent.mt"), ncol = 3)
> dev.off()
> #logでノーマライズする
> lung <- NormalizeData(lung, normalization.method = "LogNormalize", scale.factor = 10000)	# scale.factor=10000 → 1万リードあたりのtag数に正規化(default)
>
分散の大きな、特徴のある遺伝子を抽出
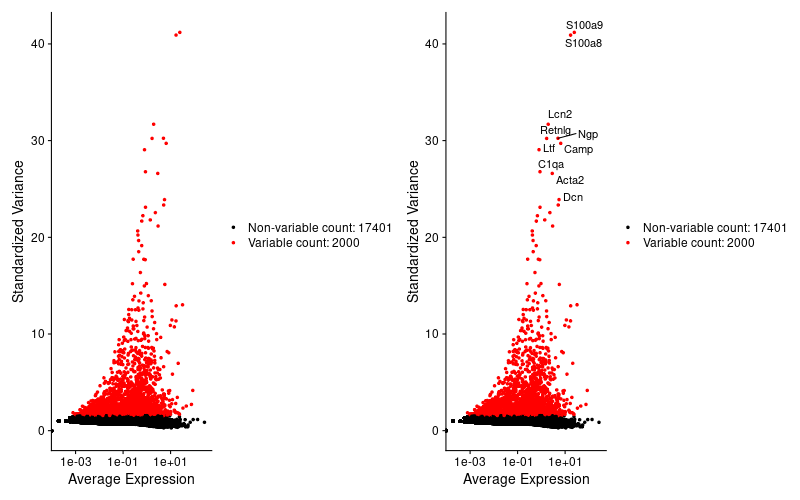
> #分散の大きい(発現変動の大きい)2000遺伝子のみを抽出し、解析に使用
> lung <- FindVariableFeatures(lung, selection.method = "vst", nfeatures = 2000)
> #遺伝子の分散をグラフ上に可視化。top10についてラベルを付加
> top10 <- head(VariableFeatures(lung), 10)
> png("top10.png", width = 800, height = 500)
> plot1 <- VariableFeaturePlot(lung)
> plot2 <- LabelPoints(plot = plot1, points = top10, repel = TRUE)
> CombinePlots(plots = list(plot1, plot2))
> dev.off()
スケーリング
> all.genes <- rownames(lung)
> lung <- ScaleData(lung, features = all.genes)
> # 少々時間かかる;メモリも食う
> # lung <- ScaleData(lung)とすると、2000遺伝子のみをスケーリングするため短時間で済む。PCA解析やクラスタリングは2000遺伝子を用いるため影響はないが、ヒートマップを描く際にスケーリングしていない遺伝子を入れる場合は再スケーリングする必要が出てくる
>
> # lungオブジェクトのデータを保存する
> save (lung, file="lung.Rdata")
> q()

$ R

> # 一度Rを閉じて、作業を再開する場合は、lung.Rdataを読み込む
> library(Seurat)
> library(dplyr)
> set.seed(1234)
> load ("lung.Rdata")
PCAによる次元削減
> lung <- RunPCA(lung, features = VariableFeatures(object = lung))
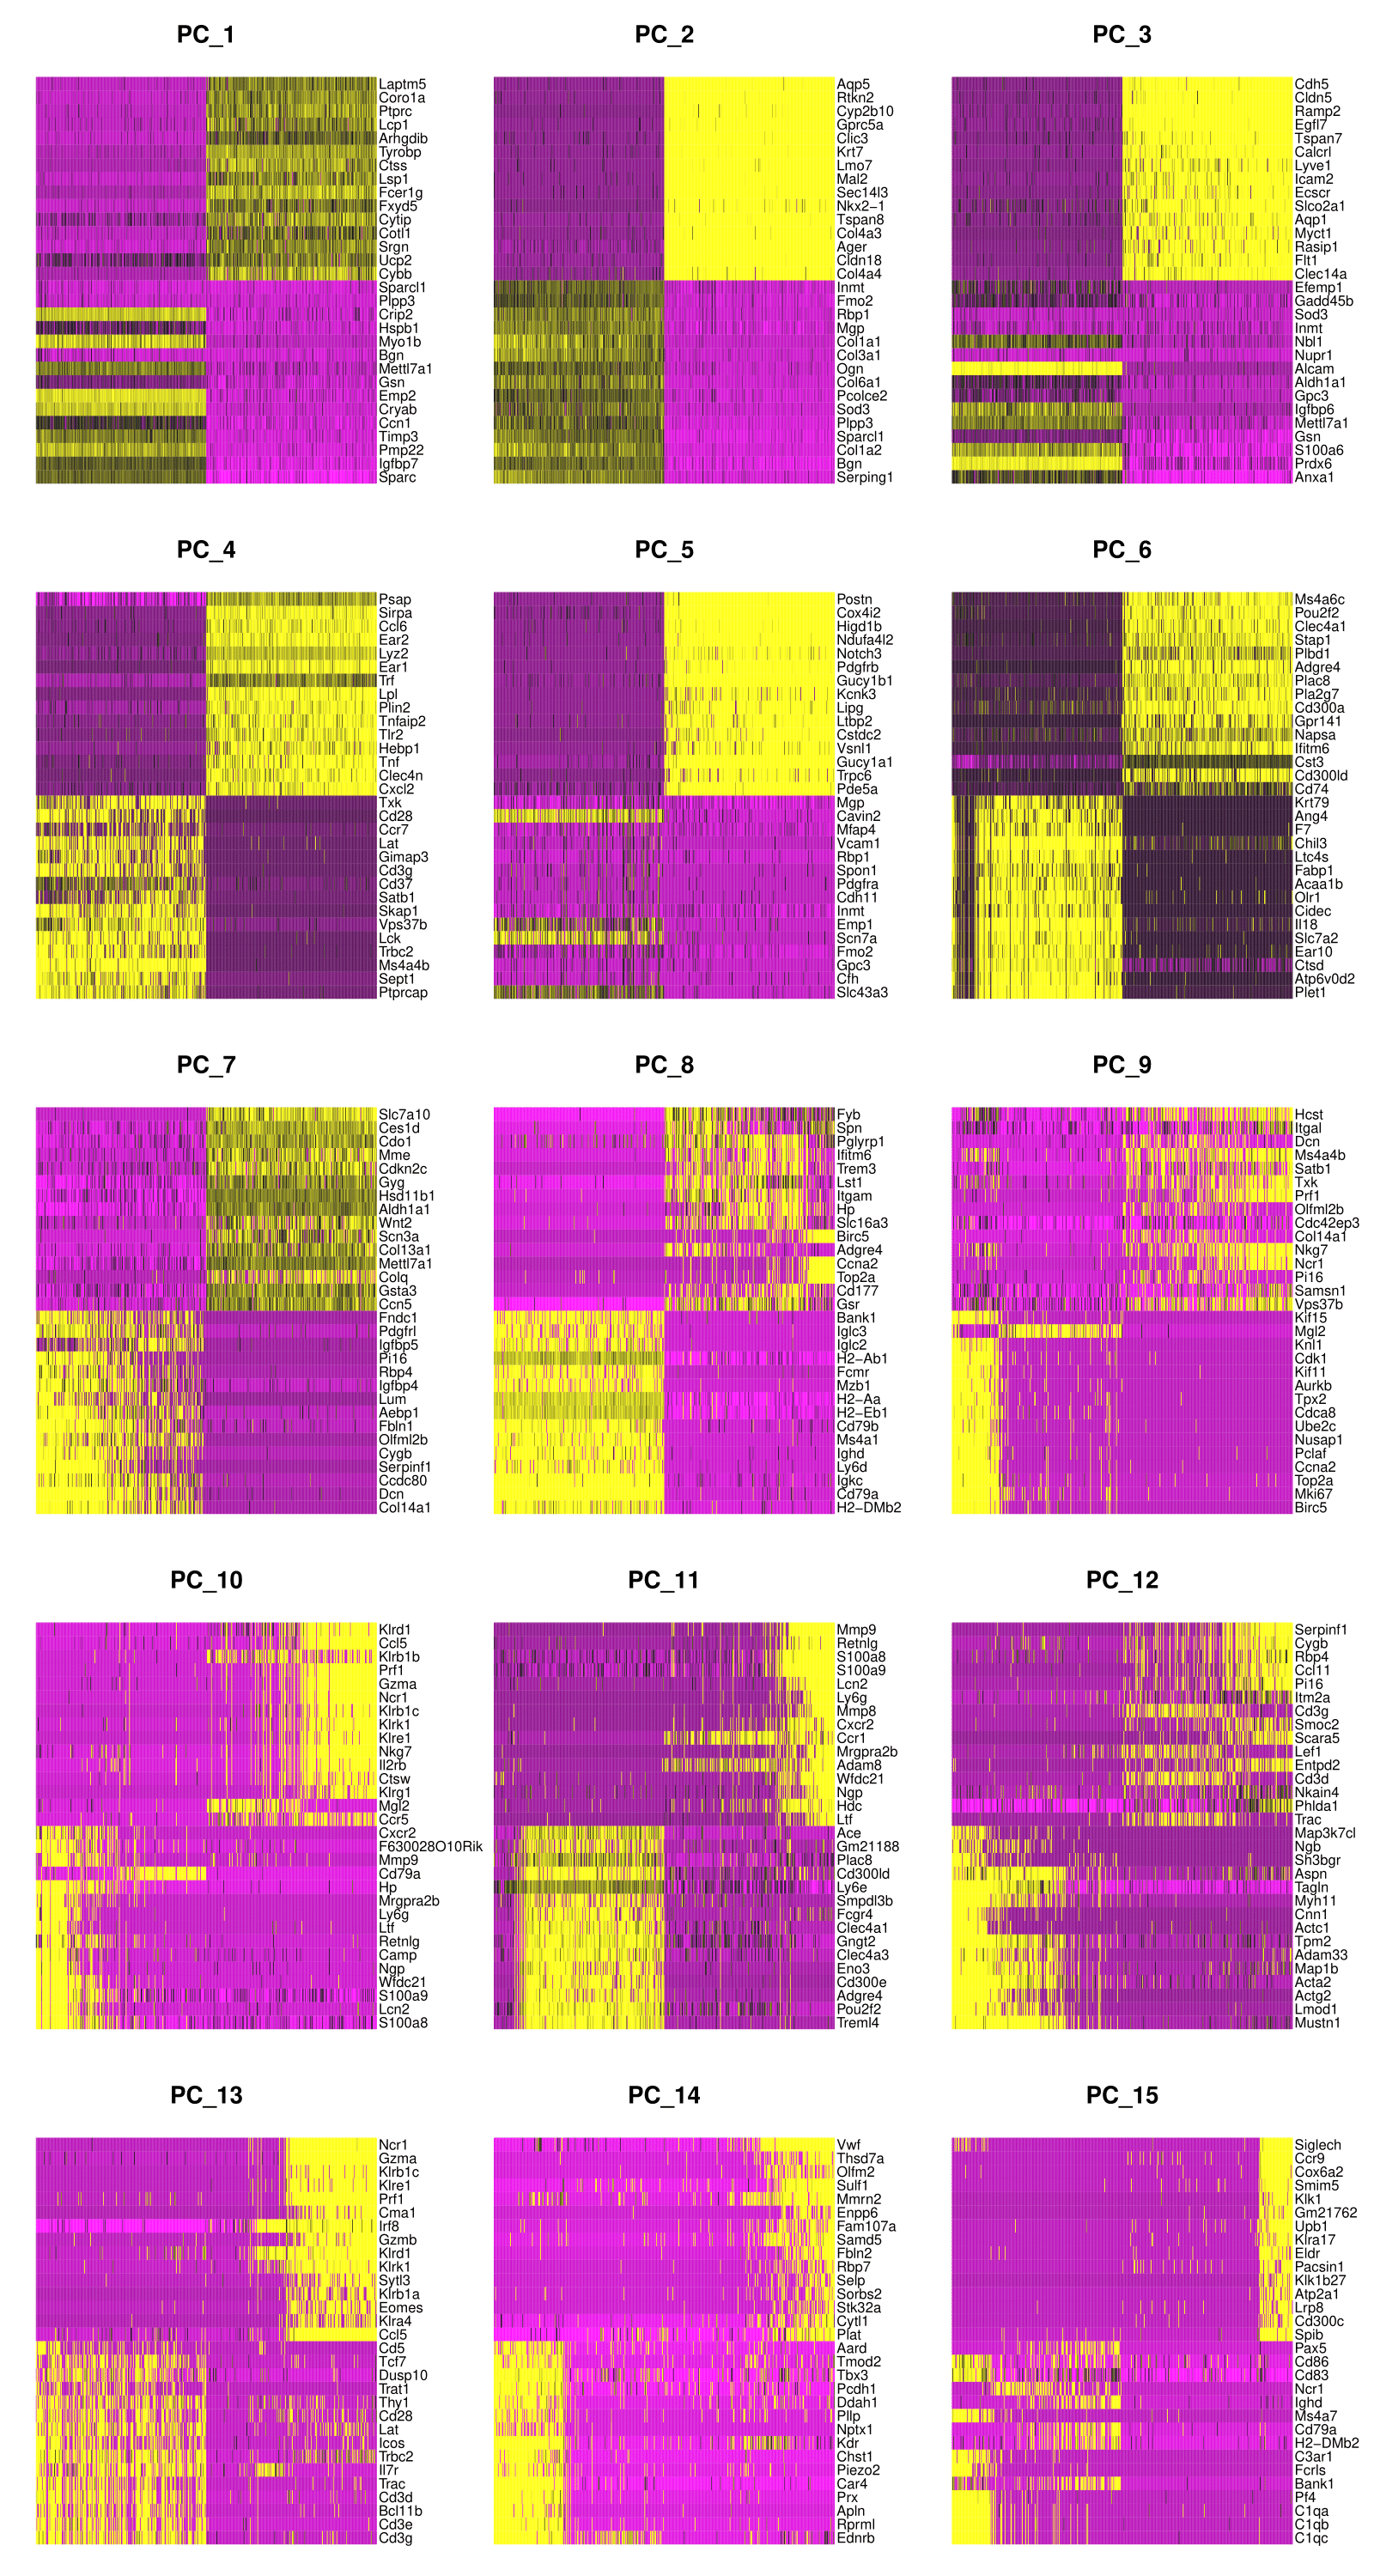
> print(lung[["pca"]], dims = 1:5, nfeatures = 5)
PC_ 1
Positive:  Sparc, Igfbp7, Pmp22, Timp3, Ccn1
Negative:  Laptm5, Coro1a, Ptprc, Lcp1, Arhgdib
PC_ 2
Positive:  Serping1, Bgn, Col1a2, Sparcl1, Plpp3
Negative:  Aqp5, Rtkn2, Cyp2b10, Gprc5a, Clic3
PC_ 3
Positive:  Anxa1, Prdx6, S100a6, Gsn, Mettl7a1
Negative:  Cdh5, Cldn5, Ramp2, Egfl7, Tspan7
PC_ 4
Positive:  Ptprcap, Sept1, Ms4a4b, Trbc2, Lck
Negative:  Psap, Sirpa, Ccl6, Ear2, Lyz2
PC_ 5
Positive:  Slc43a3, Cfh, Gpc3, Fmo2, Scn7a
Negative:  Postn, Cox4i2, Higd1b, Ndufa4l2, Notch3
>
> png("pca.png", width = 800, height = 500)
> DimPlot(lung, reduction = "pca")
> dev.off()
>
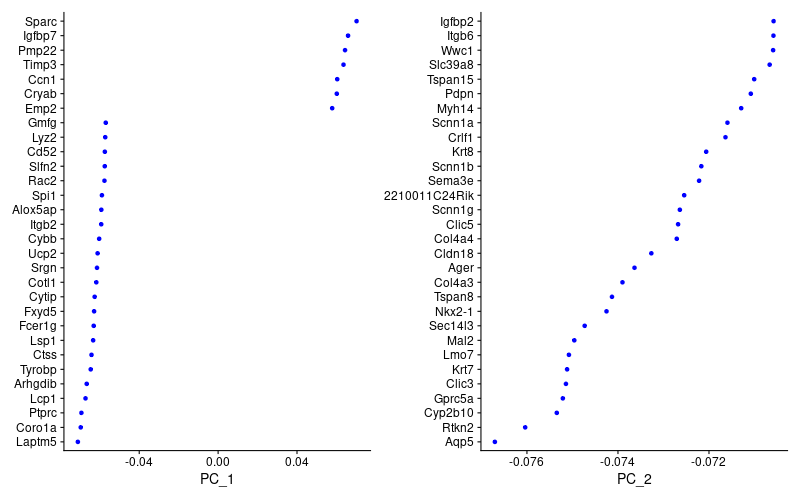
> png("VizDimLoadings.png", width = 800, height = 500)
> VizDimLoadings(lung, dims = 1:2, reduction = "pca")
> dev.off()

|
|
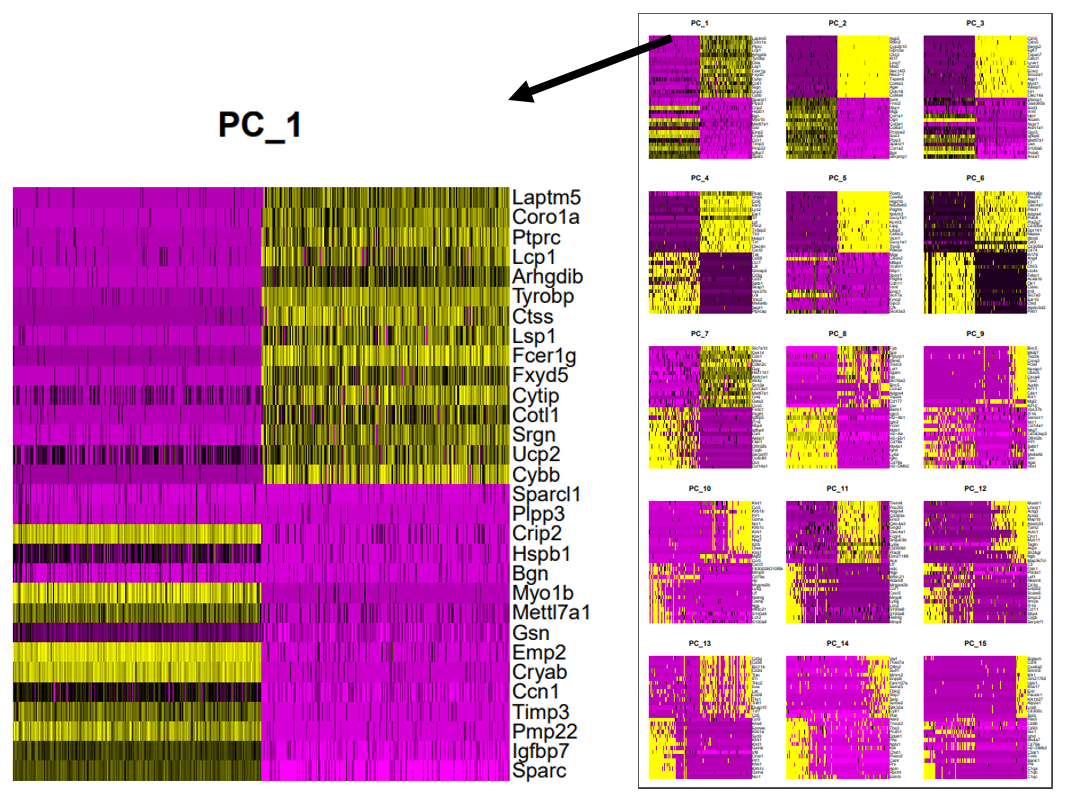
> pdf("heatmap_dim_1_15.pdf", width = 8, height = 15)
> DimHeatmap(lung, dims = 1:15, cells = 500, balanced = TRUE)
> dev.off()
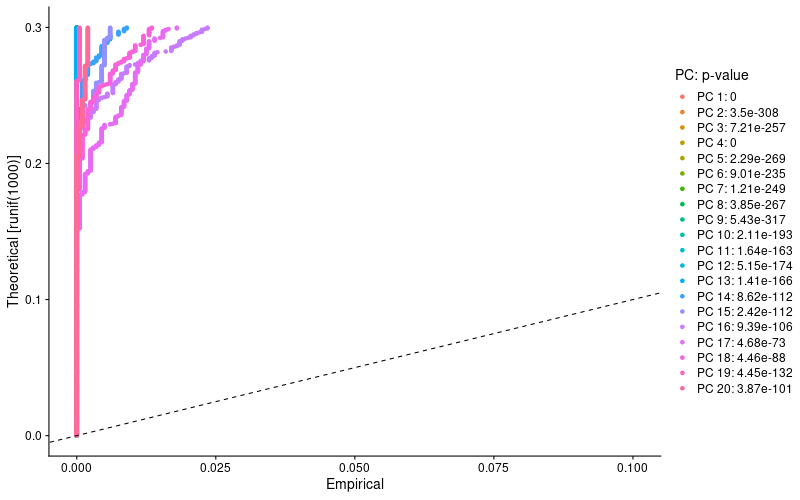
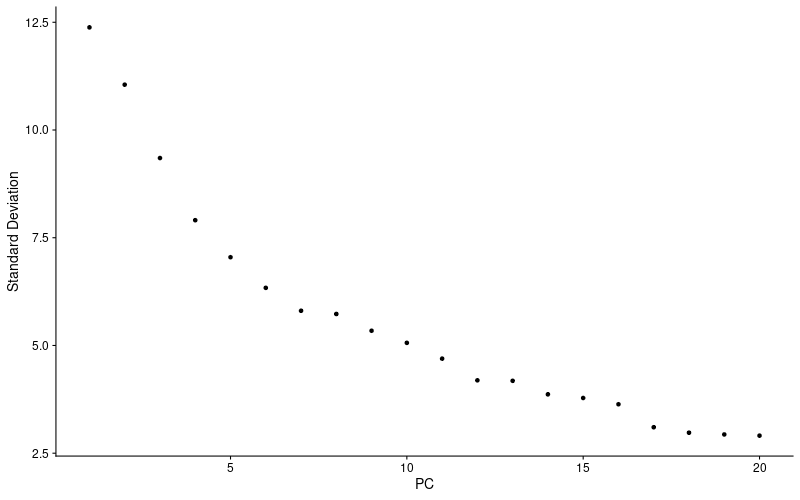
> #以後の解析に用いる次元数を決める
> #少し時間がかかる。時間があればもっと次元数を増やしたほうが良い
> lung <- JackStraw(lung, num.replicate = 100, dims = 20)
> lung <- ScoreJackStraw(lung, dims = 1:20)
>
> png("JackStraw.png", width = 800, height = 500)
> JackStrawPlot(lung, dims = 1:20)
> dev.off()
>
> png("ElbowPlot.png", width = 800, height = 500)
> ElbowPlot(lung)
> dev.off()
|
|
> # クラスタリング
> lung <- FindNeighbors(lung, dims = 1:10)	#仮にPC1-10で解析を進めています
> lung <- FindClusters(lung, resolution = 0.5)
>
> # UMAPで二次元プロット
> lung <- RunUMAP(lung, dims = 1:10)	#tSNEが良い場合はRunTSNE関数を使います
>
> png("umap.png", width = 800, height = 500)
> DimPlot(lung, reduction = "umap")
> dev.off()
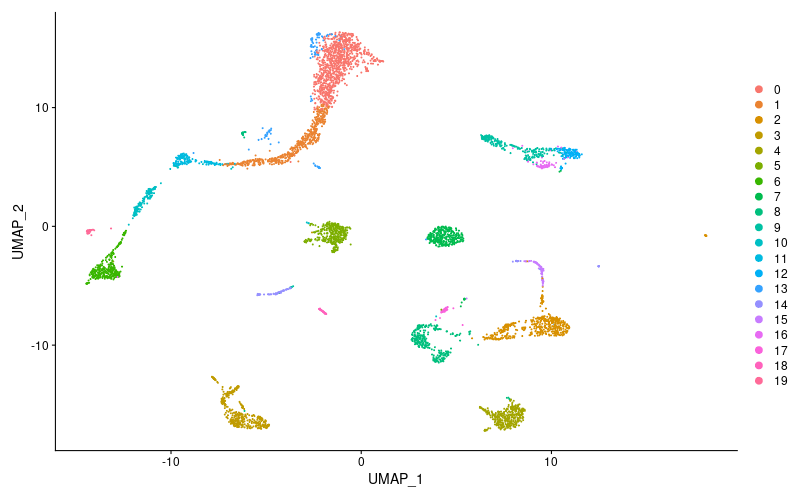
Differentially expressed gene (DEG)の検出
- wilcox: Wilcoxon Rank Sum test (default)
- bimod: Likelihood-ratio test
- roc: Standard AUC classifier
- t: Student’s t-test
- poisson: Use only for UMI-based datasets
- LR: Uses a logistic regression framework
- negbinom: Use only for UMI-based datasets
- MAST: GLM-framework
- DESeq2
> #全クラスター
> lung.markers <- FindAllMarkers(lung, only.pos = TRUE, min.pct = 0.25, logfc.threshold = 0.25) #かなり時間がかかる。
> lung.markers %>% group_by(cluster) %>% top_n(n = 2, wt = avg_logFC)
Registered S3 method overwritten by 'cli':
  method     from
  print.boxx spatstat
# A tibble: 42 x 7
# Groups:   cluster [21]
       p_val avg_logFC pct.1 pct.2 p_val_adj cluster gene

 1 0.             2.02 0.986 0.298 0.        0       Ces1d
 2 0.             1.96 0.998 0.538 0.        0       Mfap4
 3 1.45e-243      1.77 1     0.846 2.82e-239 1       Mgp
 4 2.29e-238      1.62 0.981 0.411 4.44e-234 1       Cxcl14
 5 0.             2.32 0.971 0.259 0.        2       Plac8
 6 0.             2.21 0.978 0.157 0.        2       Lst1
 7 0.             3.19 0.972 0.086 0.        3       Cldn5
 8 0.             3.16 0.992 0.17  0.        3       Ramp2
 9 0.             3.27 1     0.153 0.        4       Chil3
10 0.             2.78 0.954 0.17  0.        4       Tnf
# ... with 32 more rows
>
> #各クラスターの上位10マーカーを抽出
> top10 <- lung.markers %>% group_by(cluster) %>% top_n(n = 10, wt = avg_logFC)
> #テキストに出力(top10のみ)
> write.table(top10, "top10.csv",append = FALSE, quote = TRUE, sep = "," ,row.names = TRUE, col.names = TRUE)
>
> # 各クラスターで個別に解析した場合:
> # クラスター1での発現変動遺伝子の同定
> cluster1.markers <- FindMarkers(lung, ident.1 = 1, min.pct = 0.25)
> #クラスター5とクラスター0,3間での発現変動遺伝子
> cluster5.markers <- FindMarkers(lung, ident.1 = 5, ident.2 = c(0, 3), min.pct = 0.25)
>
> #各クラスターの上位10マーカーのヒートマップ図を出力
> pdf("DoHeatmap_top10.pdf", width = 25, height = 20)
> DoHeatmap(lung, features = top10$gene) + NoLegend()
> dev.off()
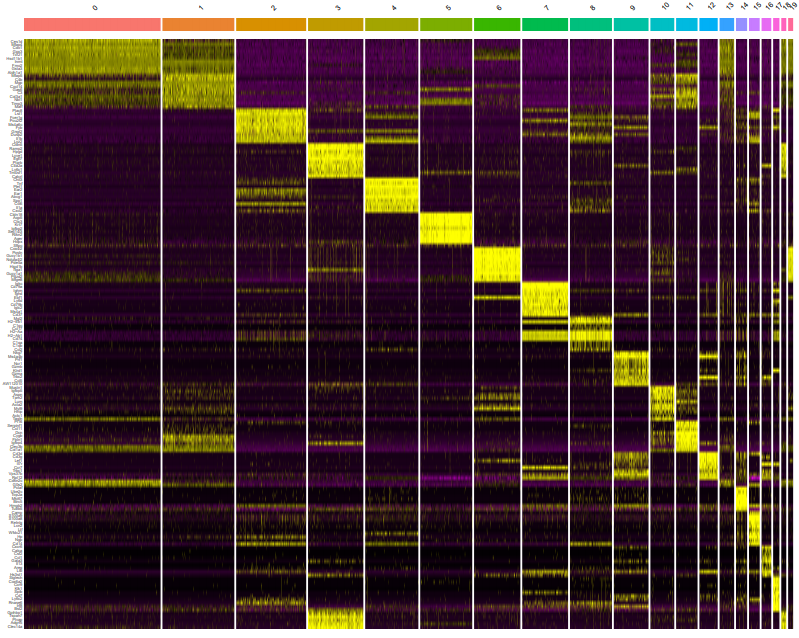
アノテーション(細胞種同定)
| Cell type | Cell markers | ||
|---|---|---|---|
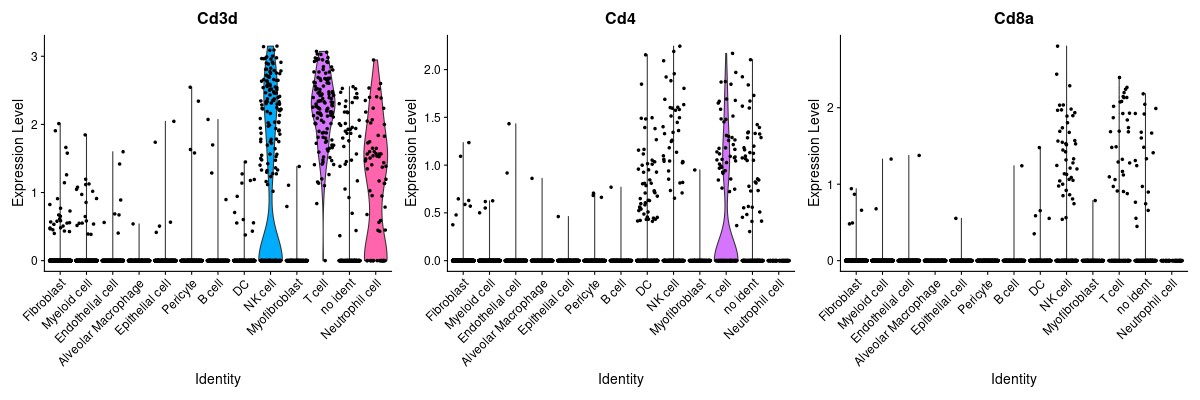
| Immune cell Ptprc(CD45)+ | T cell | Cd3d, Cd4, Cd8a | |
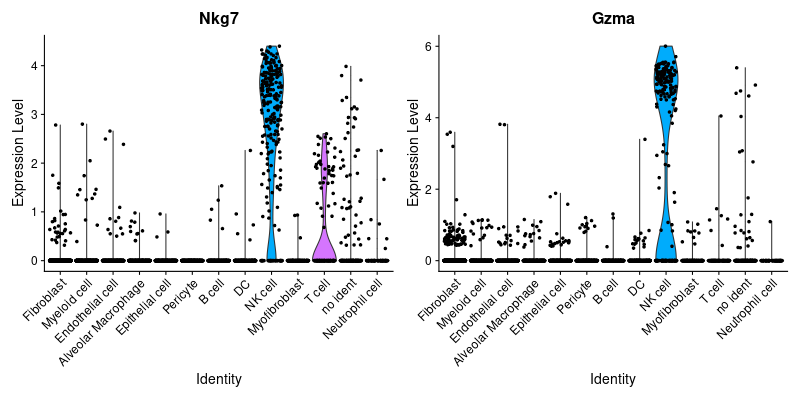
| NK cell | Cd3d(-), Nkg7, Gzma | ||
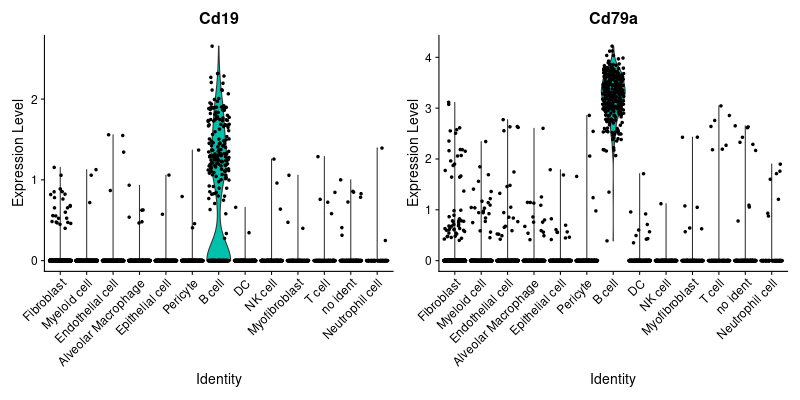
| B cell | Cd19, Cd79a | ||
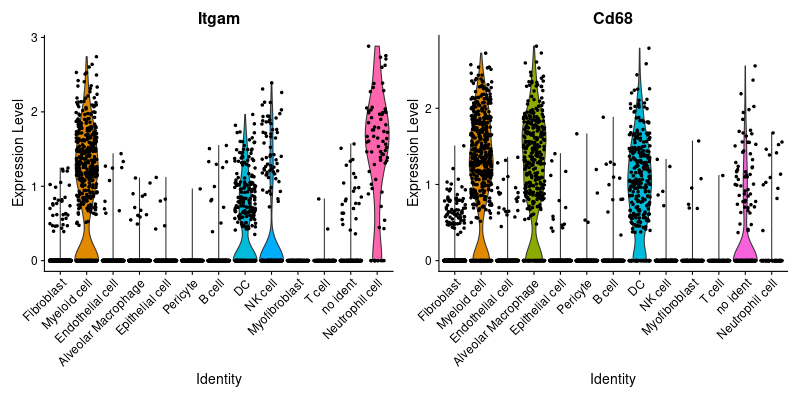
| Myeloid cell | Macrophage | Itgam(CD11b) | |
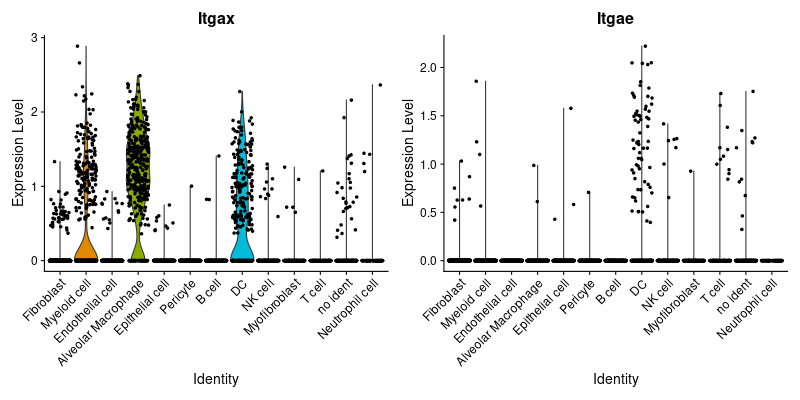
| Alveolar macrophage | Itgax(CD11c), Siglecf | ||
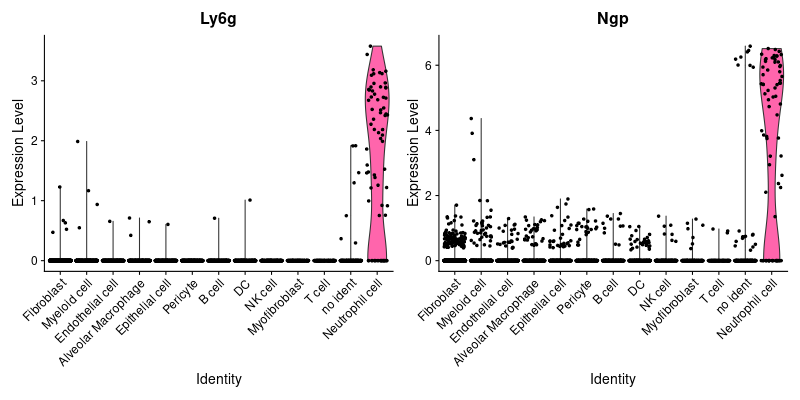
| Neutrophil | Ly6g, Ngp | ||
| DC | Itgax(CD11c), Itgae(CD103) | ||
| ILC (Nuocyte or NH) | Cd3d(-), IL2RA(CD25), Gata3+ | ||
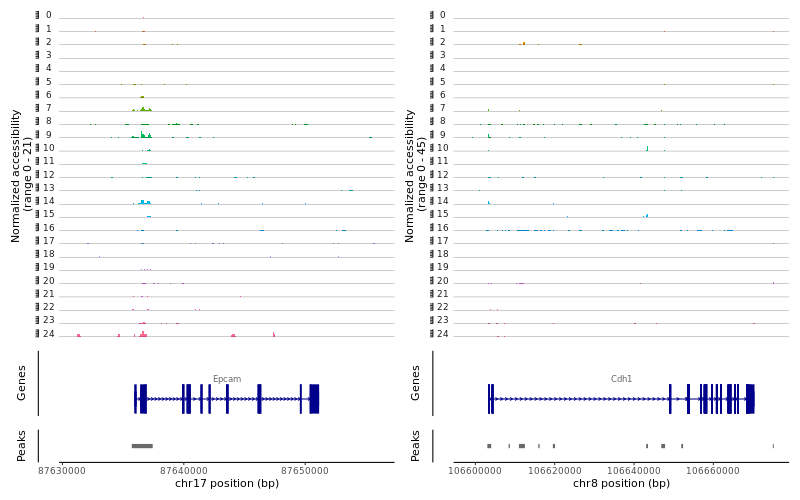
| Non-immune cell | Epithelial cell | Epcam, Cdh1 | |
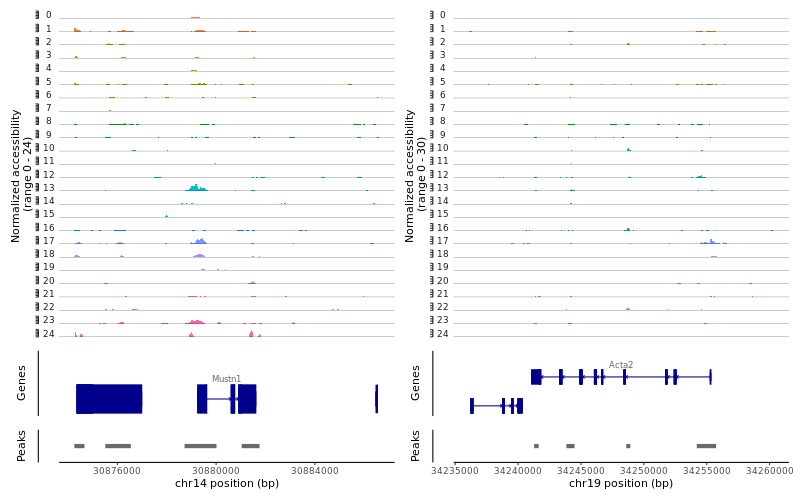
| Myofibroblast | Acta2, Mustn1 | ||
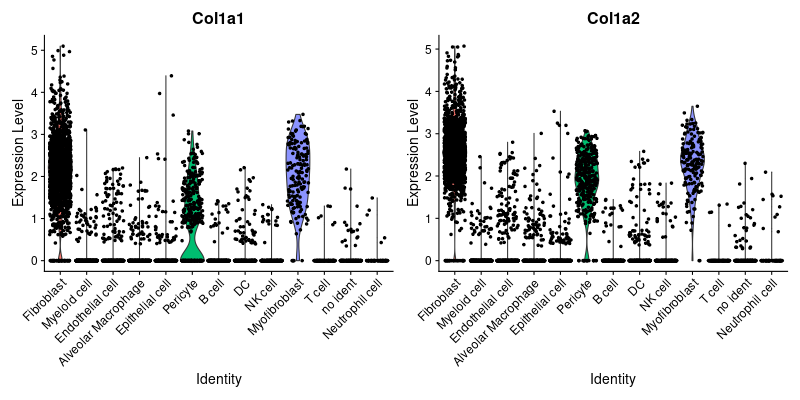
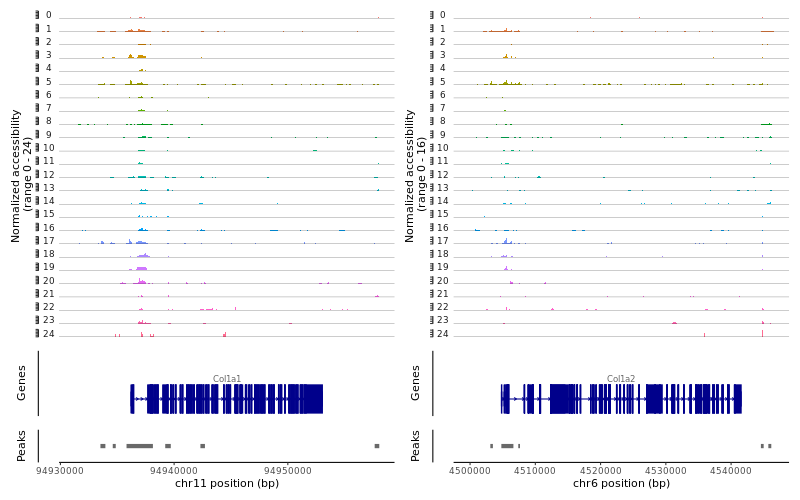
| Fibroblast | Col1a1, Cpl1a2 | ||
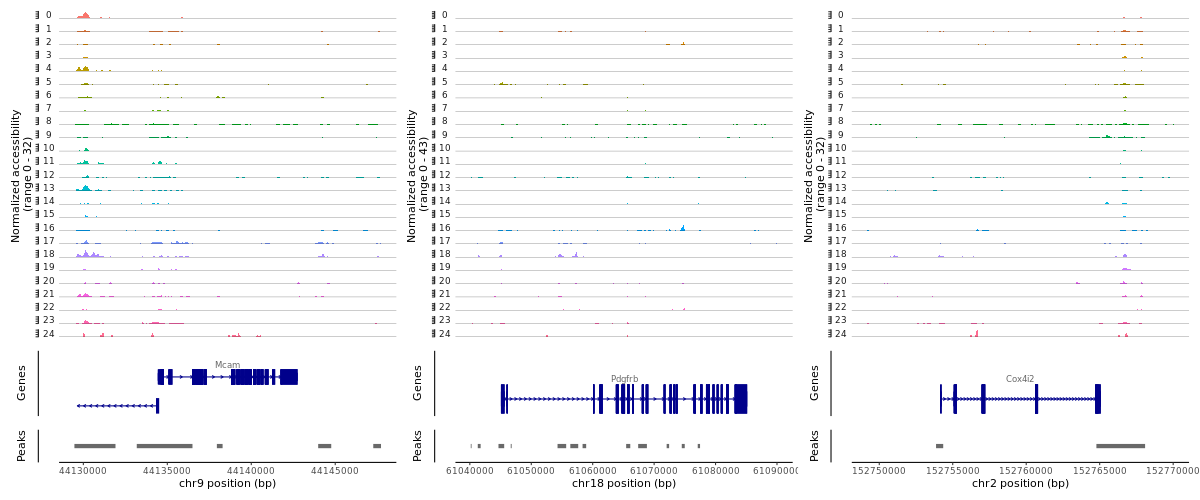
| Pericyte | Mcam, Pdgfrb, Cox4i2 | ||
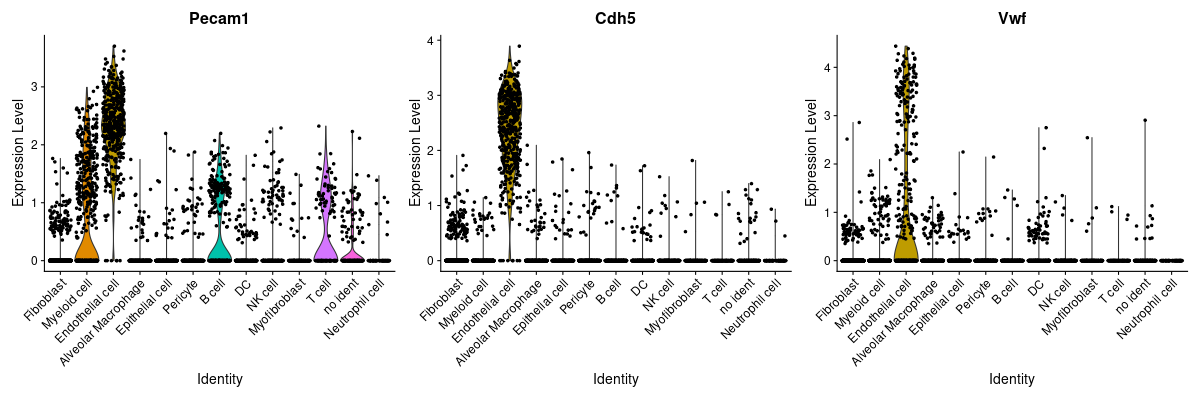
| Endothelial cell | Pecam1(CD31), Cdh5, Vwf | ||
マーカーとなる遺伝子を定義
> Immune <- c("Ptprc") #CD45
> T <- c("Cd3d", "Cd4", "Cd8a")
> NK <- c("Nkg7", "Gzma")
> B <- c("Cd19", "Cd79a")
> Myeloid <- c("Itgam", "Cd68")
> AlveolarMacrophage <- c("Itgax", "Siglecf", "Cd68")
> DC <- c("Itgax", "Itgae")
> Neutrophil <- c("Ly6g", "Ngp")
> Epithelial <- c("Epcam","Cdh1")
> Myofibroblast <- c("Mustn1","Acta2")
> Fibroblast <- c("Col1a1", "Col1a2")
> Endothelial <- c("Pecam1", "Cdh5", "Vwf")
> Pericyte <- c("Mcam", "Pdgfrb", "Cox4i2")
免疫関連細胞クラスターの同定
> #バイオリンプロット(Immune cell)
> png("vlnplot_Immune.png", width=400, height=400)
> VlnPlot(lung, features = Immune)
> dev.off()
>
> #マーカー遺伝子の発現量でUMAPプロットを色塗り(Immune cell)
> png("FeaturePlot_Immune.png", width=400, height=400)
> FeaturePlot(lung, features = Immune)
> dev.off()
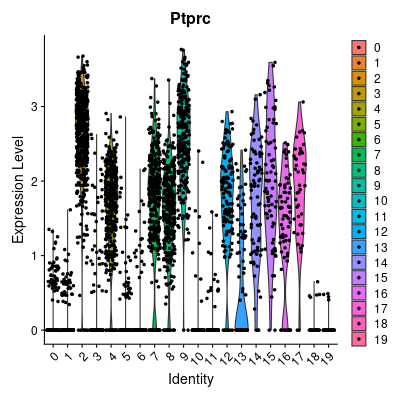
|

|
その他の細胞種についても可視化を行う
> #T cell
> png("vlnplot_T.png", width=1200, height=400)
> VlnPlot(lung, features = T)
> dev.off()
> png("FeaturePlot_T.png", width=2400, height=500)
> FeaturePlot(lung, features = T, ncol = 3)
> dev.off()
>
> #NK cell
> png("vlnplot_NK.png", width=800, height=400)
> VlnPlot(lung, features = NK)
> dev.off()
> png("FeaturePlot_NK.png", width=1600, height=500)
> FeaturePlot(lung, features = NK)
> dev.off()
>
> #B cell
> png("vlnplot_B.png", width=800, height=400)
> VlnPlot(lung, features = B)
> dev.off()
> png("FeaturePlot_B.png", width=1600, height=500)
> FeaturePlot(lung, features = B)
> dev.off()
>
> #Myeloid cell
> png("vlnplot_Myeloid.png", width=800, height=400)
> VlnPlot(lung, features = Myeloid)
> dev.off()
> png("FeaturePlot_Myeloid.png", width=1600, height=500)
> FeaturePlot(lung, features = Myeloid)
> dev.off()
>
> #Alveolar Macrophage
> png("vlnplot_AlveolarMacrophage.png", width=1200, height=400)
> VlnPlot(lung, features = AlveolarMacrophage)
> dev.off()
> png("FeaturePlot_AlveolarMacrophage.png", width=2400, height=500)
> FeaturePlot(lung, features = AlveolarMacrophage, ncol = 3)
> dev.off()
>
> #DC
> png("vlnplot_DC.png", width=800, height=400)
> VlnPlot(lung, features = DC)
> dev.off()
> png("FeaturePlot_DC.png", width=1600, height=500)
> FeaturePlot(lung, features = DC)
> dev.off()
>
> #Neutrophil
> png("vlnplot_Neutrophil.png", width=800, height=400)
> VlnPlot(lung, features = Neutrophil)
> dev.off()
> png("FeaturePlot_Neutrophil.png", width=1600, height=500)
> FeaturePlot(lung, features = Neutrophil)
> dev.off()
>
> #Epithelial cell
> png("vlnplot_Epithelial.png", width=800, height=400)
> VlnPlot(lung, features = Epithelial)
> dev.off()
> png("FeaturePlot_Epithelial.png", width=1600, height=500)
> FeaturePlot(lung, features = Epithelial)
> dev.off()
>
> #Myofibroblast
> png("vlnplot_Myofibroblast.png", width=800, height=400)
> VlnPlot(lung, features = Myofibroblast)
> dev.off()
> png("FeaturePlot_Myofibroblast.png", width=1600, height=500)
> FeaturePlot(lung, features = Myofibroblast)
> dev.off()
>
> #Fibroblast
> png("vlnplot_Fibroblast.png", width=800, height=400)
> VlnPlot(lung, features = Fibroblast)
> dev.off()
> png("FeaturePlot_Fibroblast.png", width=1600, height=500)
> FeaturePlot(lung, features = Fibroblast)
> dev.off()
>
> #Endothelial cell
> png("vlnplot_Endothelial.png", width=1200, height=400)
> VlnPlot(lung, features = Endothelial)
> dev.off()
> png("FeaturePlot_Endothelial.png", width=2400, height=500)
> FeaturePlot(lung, features = Endothelial, ncol = 3)
> dev.off()
>
> #Pericyte
> png("vlnplot_Pericyte.png", width=1200, height=400)
> VlnPlot(lung, features = Pericyte)
> dev.off()
> png("FeaturePlot_Pericyte.png", width=2400, height=500)
> FeaturePlot(lung, features = Pericyte, ncol = 3)
> dev.off()
>
> #クラスターへの細胞種の割り当て
> new.cluster.ids <- c("Fibroblast", "Fibroblast", "Myeloid cell", "Endothelial cell", "Alveolar Macrophage", "Epithelial cell", "Pericyte", "B cell", "DC", "NK cell", "Myofibroblast", "Fibroblast", "T cell", "Fibroblast", "no ident", "Neutrophil cell", "no ident", "no ident", "Endothelial cell", "Pericyte", "no ident")
>
> names(new.cluster.ids) <- levels(lung)
> lung <- RenameIdents(lung, new.cluster.ids)
>
> #ラベル付きでUMAPプロットを出力
> png("umap_cls.png", width = 800, height = 500)
> DimPlot(lung, reduction = "umap", label = TRUE, pt.size = 0.5)
> dev.off()
>
> #lungオブジェクトをファイルに保存します(後でscATAC-Seqとの統合解析に使用します)
> saveRDS(lung, file="lung_rna.rds")
>
> #これまでの作業を保存する場合(実際には以降では使用しません)
> save (lung, file="lung_ok.Rdata")
>
> #一度Rを閉じて、作業を再開する場合は、lunlg_ok.Rdataを読み込む
> load ("lung_ok.Rdata")
>
> q()
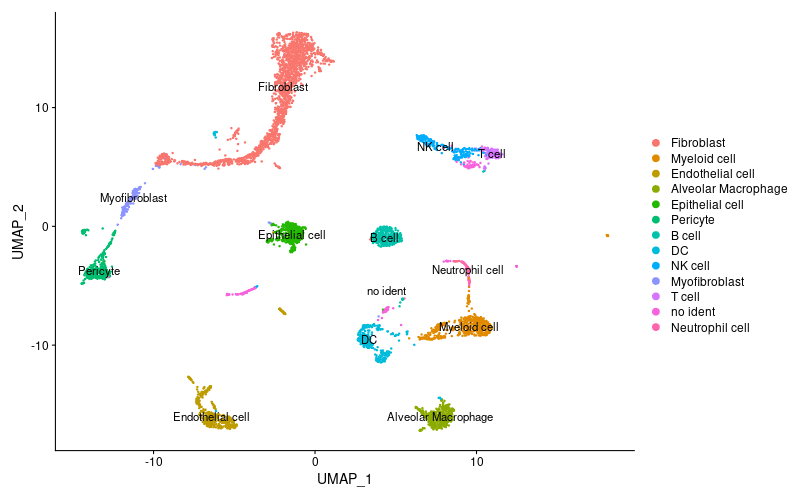
Signacを使ったscATAC-seq解析
データの確認と解析準備
$ mkdir ~/analysis_scATAC/Signac #解析ディレクトリを作成
$ cd ~/analysis_scATAC/Signac
$ R
> #必要なライブラリを読み込む
> library(Signac)
> library(Seurat)
> library(GenomeInfoDb)
> BiocManager::install("EnsDb.Mmusculus.v79")
> library(EnsDb.Mmusculus.v79)
> #BiocManager::install("EnsDb.Hsapiens.v75") #humanの場合
> #library(EnsDb.Hsapiens.v75) #humanの場合
> library(ggplot2)
> library(patchwork)
> set.seed(1234)
データ解析
- filtered_peak_bc_matrix.h5
- singlecell.csv
- fragments.tsv.gz
- fragments.tsv.gz.tbi
> #入力ファイル読み込み
> counts <- Read10X_h5(filename = "~/analysis_scATAC/emm_atac/outs/filtered_peak_bc_matrix.h5")	#peakのファイル
>
> #データ読み込み
> metadata <- read.csv(file = "~/analysis_scATAC/emm_atac/outs/singlecell.csv", header = TRUE, row.names = 1)
>
> #fragmentファイル読み込み
> chrom_assay <- CreateChromatinAssay(counts = counts, sep = c(":", "-"), genome = 'mm10',
  fragments = '~/analysis_scATAC/emm_atac/outs/fragments.tsv.gz', min.cells = 1, min.features = 200)
>
> #Seuratオブジェクトの生成
> lung <- CreateSeuratObject(counts = chrom_assay, assay = 'peaks', project = 'ATAC', meta.data = metadata)
>
> #lungに遺伝子アノテーション情報を追加(CoveragePlotに遺伝子アノテーションを表示するのに必要)
> annotations <- GetGRangesFromEnsDb(ensdb = EnsDb.Mmusculus.v79)
> #UCSC mm10にマップされた情報のため、Ensembl から UCSCスタイルのアノテーションに変更
> seqlevelsStyle(annotations) <- 'UCSC'
> genome(annotations) <- "mm10"
> #オブジェクトにこのannotation情報を追加
> Annotation(lung) <- annotations
>
> # QC & フィルタリング
> #(mononucleosomal fragments)/(nucleosome-free fragments)
> lung <- NucleosomeSignal(object = lung, region = 'chr1-1-10000000')
>
> #ピークにアサインされたリードの割合(%)
> lung$pct_reads_in_peaks <- lung$peak_region_fragments / lung$passed_filters * 100
>
> #blacklist (artificial signalが多い場所)にアサインされたリードの割合
> lung$blacklist_ratio <- lung$blacklist_region_fragments / lung$peak_region_fragments
>
> png("VlnPlot_FeatureScatter.png", width = 800, height = 500)
> plot1 <- VlnPlot(object = lung,features = c('pct_reads_in_peaks', 'blacklist_ratio', 'nucleosome_signal'),pt.size = 0.1) + NoLegend()
> plot2_a <- VlnPlot(object = lung,features = 'peak_region_fragments',pt.size = 0.1, log = TRUE) + NoLegend()
> plot2_b <- FeatureScatter(lung,"peak_region_fragments",'blacklist_ratio', pt.size = 0.1) + NoLegend()
> plot2_c <- FeatureScatter(lung,"peak_region_fragments",'nucleosome_signal', pt.size = 0.1) + NoLegend()
> plot2 <- CombinePlots(plots = list(plot2_a,plot2_b,plot2_c), ncol = 3)
> CombinePlots(list(plot1,plot2),ncol = 1)
> dev.off()
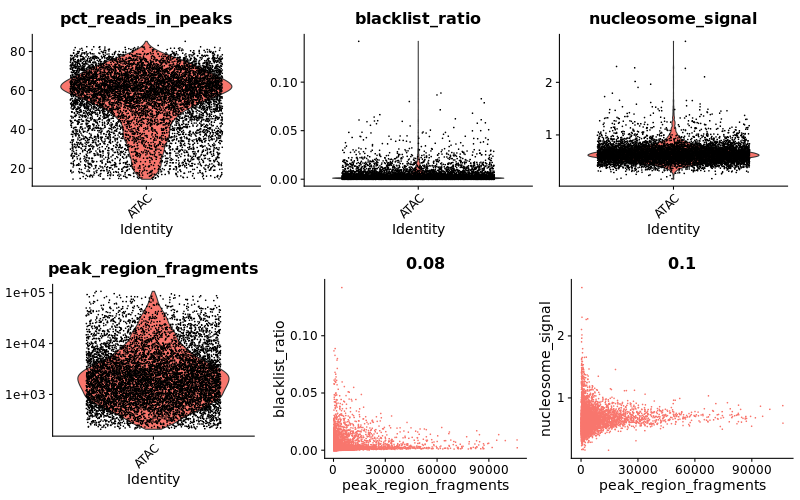
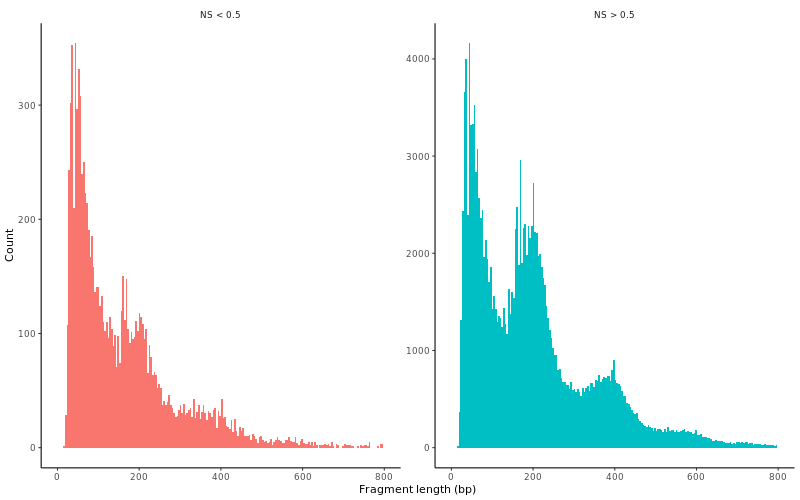
> lung$nucleosome_group <- ifelse(lung$nucleosome_signal > 0.5, 'NS > 0.5', 'NS < 0.5')
> png("PeriodPlot.png", width = 800, height = 500)
> FragmentHistogram(object = lung, group.by = 'nucleosome_group', region = 'chr1-1-10000000')
> dev.off()
>
> length(lung@meta.data$nFeature_peaks) #細胞数確認
[1] 8552
>
> #細胞フィルタリング
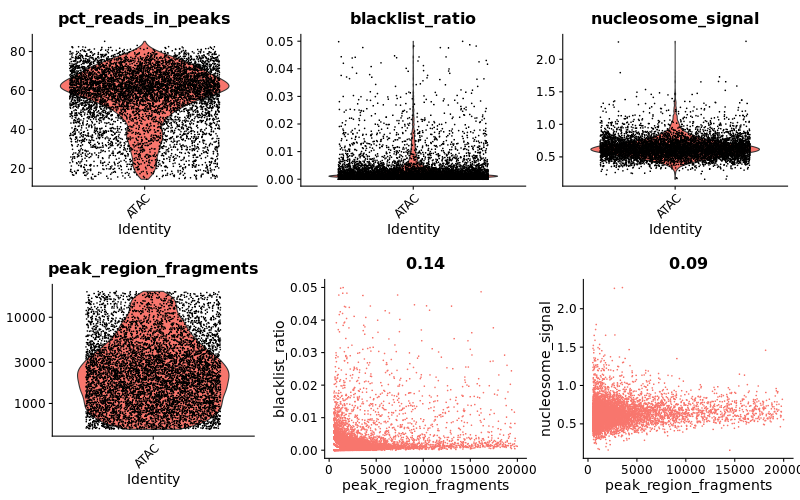
> lung <- subset(lung, subset = peak_region_fragments > 500 & peak_region_fragments < 20000 & pct_reads_in_peaks > 10 & blacklist_ratio < 0.05 & nucleosome_signal < 10)
> length(lung@meta.data$nFeature_peaks) #細胞数確認
[1] 7086
>
> #先ほどと同じようにQCの図を描いてみる
> png("VlnPlot_FeatureScatter2.png", width = 800, height = 500)
> plot1 <- VlnPlot(object = lung, features = c('pct_reads_in_peaks', 'blacklist_ratio', 'nucleosome_signal'), pt.size = 0.1) + NoLegend()
> plot2_a <- VlnPlot(object = lung, features = 'peak_region_fragments', pt.size = 0.1, log = TRUE) + NoLegend()
> plot2_b <- FeatureScatter(lung,"peak_region_fragments",'blacklist_ratio', pt.size = 0.1) + NoLegend()
> plot2_c <- FeatureScatter(lung,"peak_region_fragments",'nucleosome_signal', pt.size = 0.1) + NoLegend()
> plot2 <- CombinePlots(plots = list(plot2_a,plot2_b,plot2_c), ncol = 3)
> CombinePlots(list(plot1,plot2),ncol = 1)
> dev.off()
2D visualization by UMAP and clustering
> lung <- RunTFIDF(lung) #term frequency-inverse document frequency (TF-IDF) normalization
> lung <- FindTopFeatures(lung, min.cutoff = 'q0') #feature selection
>
> lung <- RunSVD(object = lung, assay = 'peaks', reduction.key = 'LSI_', reduction.name = 'lsi', seed.use= 1234) #dimensional reduction
> lung <- RunUMAP(object = lung, reduction = 'lsi', dims = 1:30)
> lung <- FindNeighbors(object = lung, reduction = 'lsi', dims = 1:30)
> lung <- FindClusters(object = lung, verbose = FALSE)
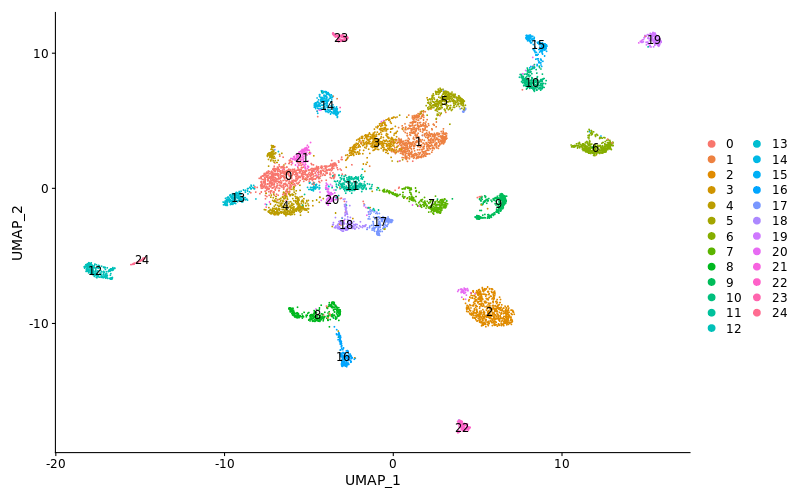
> png("umap_scATAC.png", width = 800, height = 500)
> DimPlot(object = lung, label = TRUE)
> dev.off()
> #マーカー周辺のピークを確認
> DefaultAssay(lung) <-'peaks'
> gene.coords<-genes(EnsDb.Mmusculus.v79, filter = ~ gene_biotype== "protein_coding")
> seqlevelsStyle(gene.coords) <-'UCSC'
>
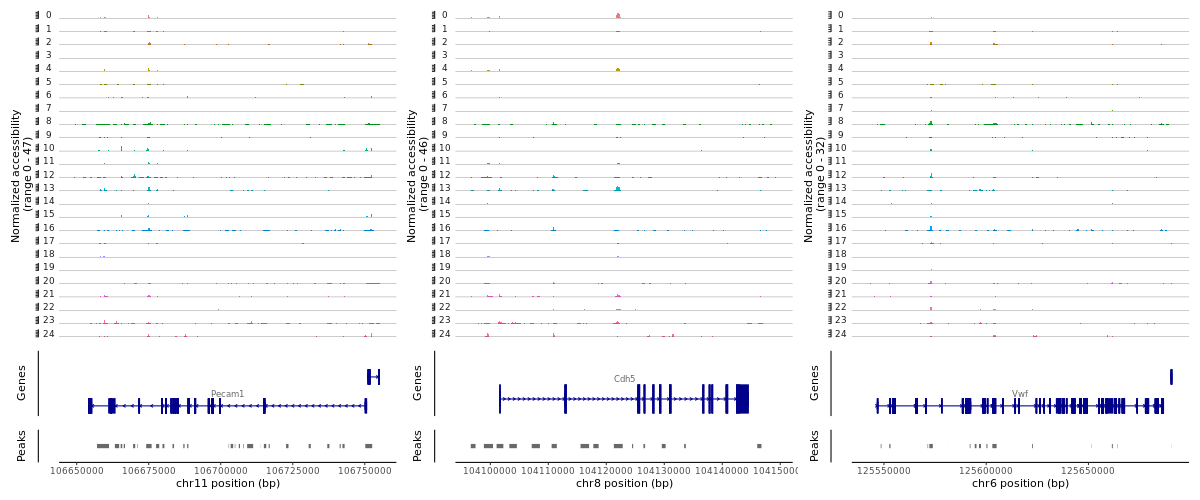
> region1 <-GRangesToString(subset(gene.coords, symbol=="Pecam1"))
> region2 <-GRangesToString(subset(gene.coords, symbol=="Cdh5"))
> region3 <-GRangesToString(subset(gene.coords, symbol=="Vwf"))
>
> #pdf("CoveragePlot_Endothelial.pdf")
> png("CoveragePlot_Endothelial.png", width = 1200, height = 500)
>
> CoveragePlot(object = lung, region = c(region1, region2, region3), extend.upstream= 5000, extend.downstream= 5000, ncol= 3)
> dev.off()
>
> #オブジェクトを保存
> save (lung, file="lung_atac.Rdata")
>
> q()
> #必要に応じて以下のライブラリを読み込んで下さい
> #load ("lung_atac.Rdata"); library(Signac); library(Seurat); library(GenomeInfoDb); library(EnsDb.Mmusculus.v79); library(ggplot2); library(patchwork); set.seed(1234);
> #gene.coords<-genes(EnsDb.Mmusculus.v79, filter = ~ gene_biotype== "protein_coding"); seqlevelsStyle(gene.coords) <-'UCSC'
>
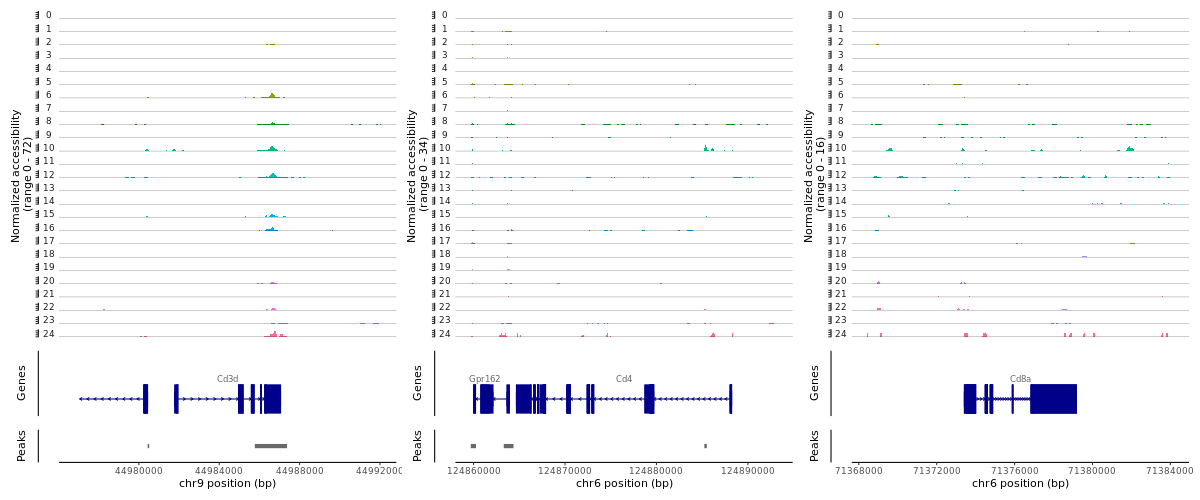
> png("CoveragePlot_T.png", width = 1200, height = 500)
> region1 <-GRangesToString(subset(gene.coords, symbol=="Cd3d"))
> region2 <-GRangesToString(subset(gene.coords, symbol=="Cd4"))
> region3 <-GRangesToString(subset(gene.coords, symbol=="Cd8a"))
> CoveragePlot(object = lung, region = c(region1, region2, region3), extend.upstream= 5000, extend.downstream= 5000, ncol= 3)
> dev.off()
>
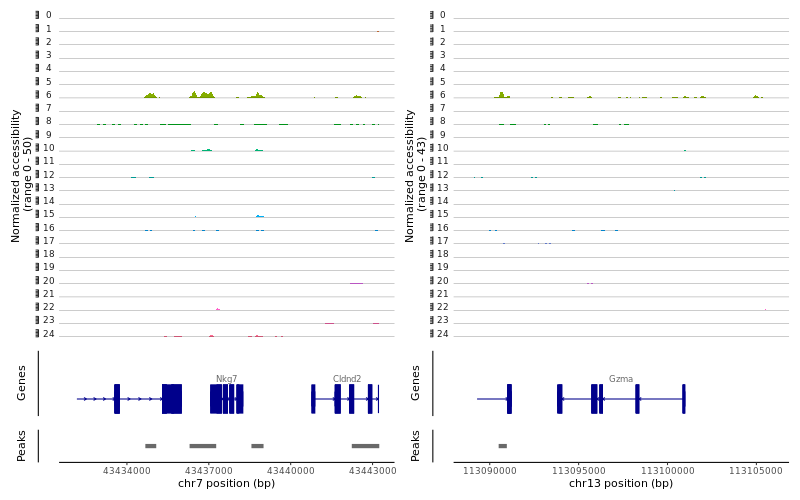
> png("CoveragePlot_NK.png", width = 800, height = 500)
> region1 <-GRangesToString(subset(gene.coords, symbol=="Nkg7"))
> region2 <-GRangesToString(subset(gene.coords, symbol=="Gzma"))
> CoveragePlot(object = lung, region = c(region1, region2), extend.upstream= 5000, extend.downstream= 5000, ncol= 2)
> dev.off()
>
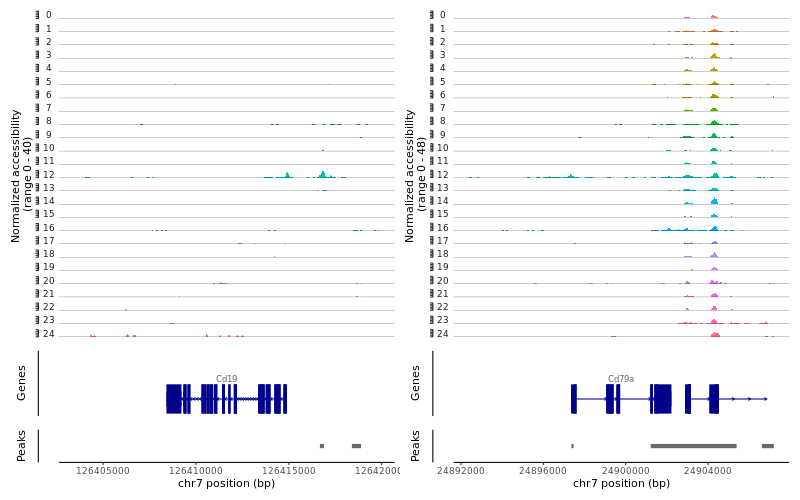
> png("CoveragePlot_B.png", width = 800, height = 500)
> region1 <-GRangesToString(subset(gene.coords, symbol=="Cd19"))
> region2 <-GRangesToString(subset(gene.coords, symbol=="Cd79a"))
> CoveragePlot(object = lung, region = c(region1, region2), extend.upstream= 5000, extend.downstream= 5000, ncol= 2)
> dev.off()
>
> png("CoveragePlot_Myeloid.png", width = 800, height = 500)
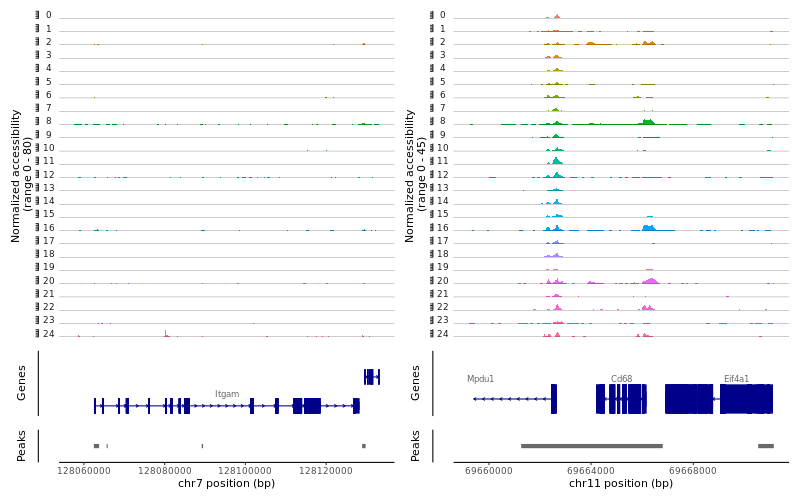
> region1 <-GRangesToString(subset(gene.coords, symbol=="Itgam"))
> region2 <-GRangesToString(subset(gene.coords, symbol=="Cd68"))
> CoveragePlot(object = lung, region = c(region1, region2), extend.upstream= 5000, extend.downstream= 5000, ncol= 2)
> dev.off()
>
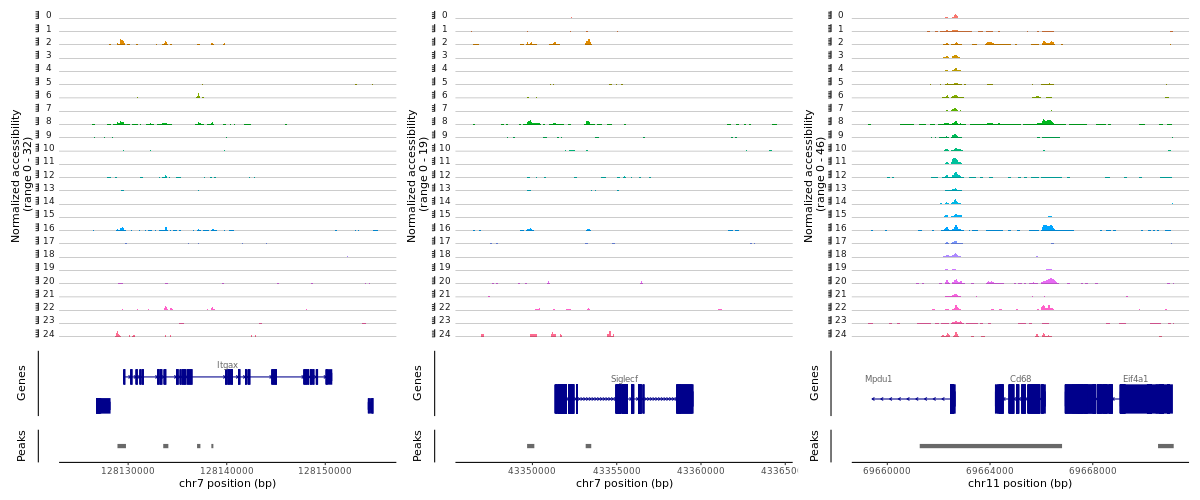
> png("CoveragePlot_AlveolarMacrophage.png", width = 1200, height = 500)
> region1 <-GRangesToString(subset(gene.coords, symbol=="Itgax"))
> region2 <-GRangesToString(subset(gene.coords, symbol=="Siglecf"))
> region3 <-GRangesToString(subset(gene.coords, symbol=="Cd68"))
> CoveragePlot(object = lung, region = c(region1, region2, region3), extend.upstream= 5000, extend.downstream= 5000, ncol= 3)
> dev.off()
>
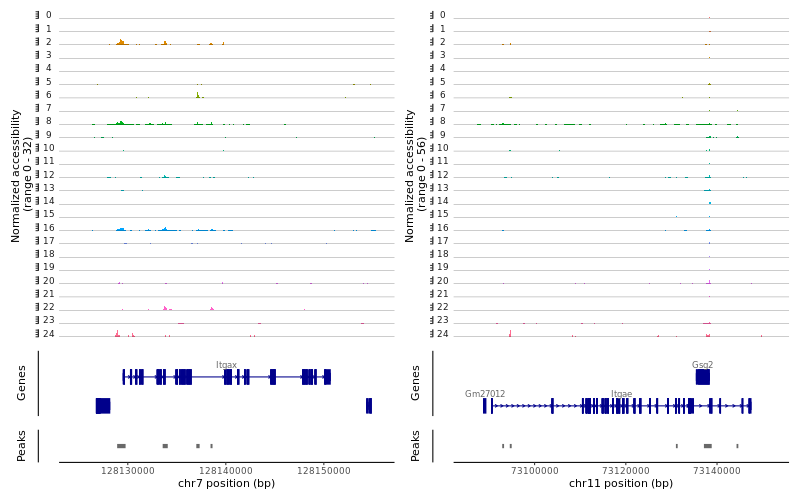
> png("CoveragePlot_DC.png", width = 800, height = 500)
> region1 <-GRangesToString(subset(gene.coords, symbol=="Itgax"))
> region2 <-GRangesToString(subset(gene.coords, symbol=="Itgae"))
> CoveragePlot(object = lung, region = c(region1, region2), extend.upstream= 5000, extend.downstream= 5000, ncol= 2)
> dev.off()
>
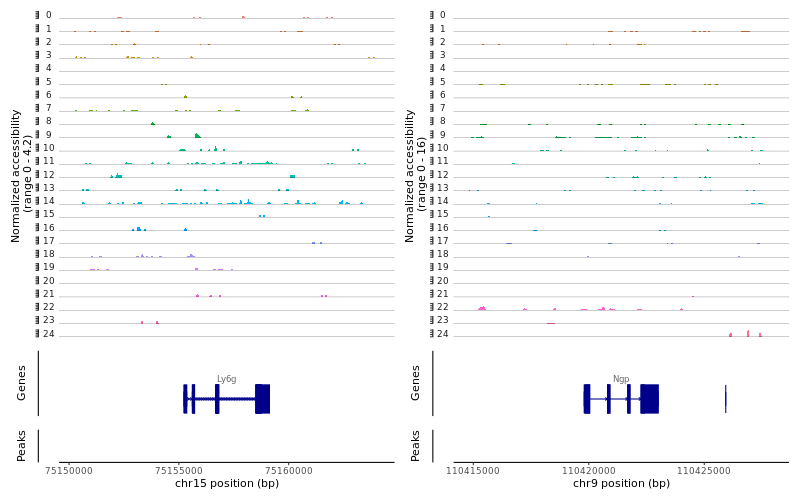
> png("CoveragePlot_Neutrophil.png", width = 800, height = 500)
> region1 <-GRangesToString(subset(gene.coords, symbol=="Ly6g"))
> region2 <-GRangesToString(subset(gene.coords, symbol=="Ngp"))
> CoveragePlot(object = lung, region = c(region1, region2), extend.upstream= 5000, extend.downstream= 5000, ncol= 2)
> dev.off()
>
> png("CoveragePlot_Epithelial.png", width = 800, height = 500)
> region1 <-GRangesToString(subset(gene.coords, symbol=="Epcam"))
> region2 <-GRangesToString(subset(gene.coords, symbol=="Cdh1"))
> CoveragePlot(object = lung, region = c(region1, region2), extend.upstream= 5000, extend.downstream= 5000, ncol= 2)
> dev.off()
>
> png("CoveragePlot_Myofibroblast.png", width = 800, height = 500)
> region1 <-GRangesToString(subset(gene.coords, symbol=="Mustn1"))
> region2 <-GRangesToString(subset(gene.coords, symbol=="Acta2"))
> CoveragePlot(object = lung, region = c(region1, region2), extend.upstream= 5000, extend.downstream= 5000, ncol= 2)
> dev.off()
>
> png("CoveragePlot_Fibroblast.png", width = 800, height = 500)
> region1 <-GRangesToString(subset(gene.coords, symbol=="Col1a1"))
> region2 <-GRangesToString(subset(gene.coords, symbol=="Col1a2"))
> CoveragePlot(object = lung, region = c(region1, region2), extend.upstream= 5000, extend.downstream= 5000, ncol= 2)
> dev.off()
>
> png("CoveragePlot_Pericyte.png", width = 1200, height = 500)
> region1 <-GRangesToString(subset(gene.coords, symbol=="Mcam"))
> region2 <-GRangesToString(subset(gene.coords, symbol=="Pdgfrb"))
> region3 <-GRangesToString(subset(gene.coords, symbol=="Cox4i2"))
> CoveragePlot(object = lung, region = c(region1, region2, region3), extend.upstream= 5000, extend.downstream= 5000, ncol= 3)
> dev.off()
>

scRNA-seq/scATAC-seq統合解析
データの読み込みと解析準備
$ mkdir ~/Integration_mouse_Lung	# 解析ディレクトリを作成
$ cd ~/Integration_mouse_Lung
$ R
> #必要なライブラリを読み込む
> library(Signac)
> library(Seurat)
> library(GenomeInfoDb)
> library(EnsDb.Mmusculus.v79)	#library(EnsDb.Hsapiens.v75) #humanの場合
> library(ggplot2)
> library(scales)
> set.seed(1234)
“gene activity matrix”の作成(scATAC-seq)
> #scATAC-seqの解析データを読み込む
> load("../analysis_scATAC/Signac/lung_atac.Rdata")
>
> #遺伝子活性マトリックスの作成するために、遺伝子本体+2 kb上流領域の情報をgene.activitiesに代入
> gene.activities <- GeneActivity(lung)
Extracting gene coordinates
Extracting reads overlapping genomic regions
  |++++++++++++++++++++++++++++++++++++++++++++++++++| 100% elapsed=04m 49s

> #scATAC-seqのgene activity matrixをオブジェクトlungに’RNA’として追加
> lung[['RNA']] <- CreateAssayObject(counts = gene.activities)
> lung <- NormalizeData(object = lung, assay = 'RNA', normalization.method = 'LogNormalize', scale.factor = median(lung$nCount_RNA))
> DefaultAssay(lung) <- 'RNA'
scRNA-seqとscATAC-seqデータの対応付け
> #scRNA-seqの解析データ(lung_rnaオブジェクト)を読み込む
> lung_rna <- readRDS("../analysis_scRNA/Seurat/lung_rna.rds")
> lung_rna$new_cluster <- Idents(lung_rna)
>
> #scRNA-seqとscATAC-seqのクラスターを対応付ける
> #lung_rna: scRNA-seqのSeuratオブジェクト、lung: scATAC-seqのSeuratオブジェクト
> transfer.anchors <- FindTransferAnchors(reference = lung_rna, query = lung, reduction = 'cca')
> predicted.labels <- TransferData(anchorset = transfer.anchors, refdata = lung_rna$new_cluster, weight.reduction = lung[['lsi']])
> lung <- AddMetaData(object = lung, metadata = predicted.labels)
>
> #以下、可視化
> #色がずれるので対応させる
> RNA_Cluster <- unique(lung_rna@active.ident)
> RNA_col <- hue_pal()(length(RNA_Cluster))	#カラーパレットより14色取得
> names(RNA_col) <- RNA_Cluster
> ATAC_Cluster <- unique(predicted.labels$predicted.id)
> ATAC_col <- RNA_col[ATAC_Cluster]
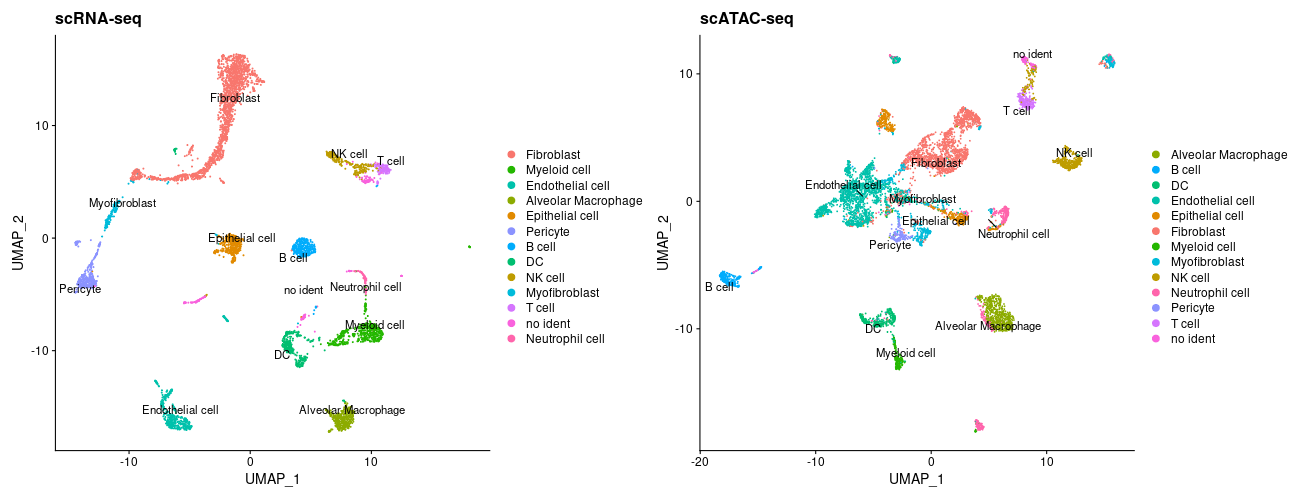
> plot1 <- DimPlot(object = lung_rna, cols = RNA_col, group.by = 'new_cluster', label = TRUE, repel = TRUE) + ggtitle('scRNA-seq')
> plot2 <- DimPlot(object = lung, cols = ATAC_col, group.by = 'predicted.id', label = TRUE , repel = TRUE) + ggtitle('scATAC-seq')
>
> png("DimPlot_RNAseq+ATACseq.png", width = 1300, height = 500)
> CombinePlots(list(plot1,plot2), ncol = 2)
> dev.off()
>
> #lungのオブジェクトデータを保存しておきたい場合
> save (lung, file="lung.Rdata")
>
> q()
> #scRNA-seqとscATAC-seqデータを統合したときのアノテーションの割当表を出力
> txt <- table(lung$seurat_clusters, lung$predicted.id)
> write.table(txt, file= "table.txt", quote=F, col.names=T, sep="¥t")
