Figure 1. Characterization and Evaluation of the scRNA-seq datasets.
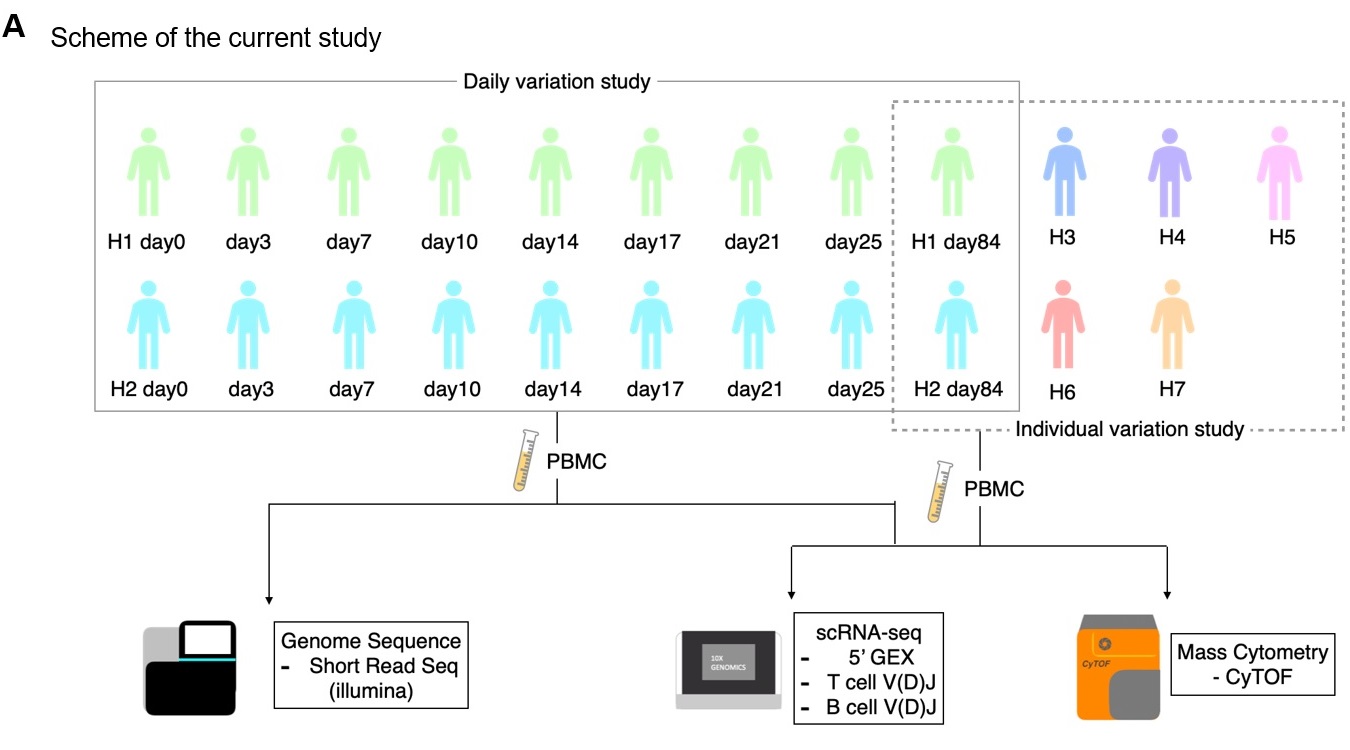
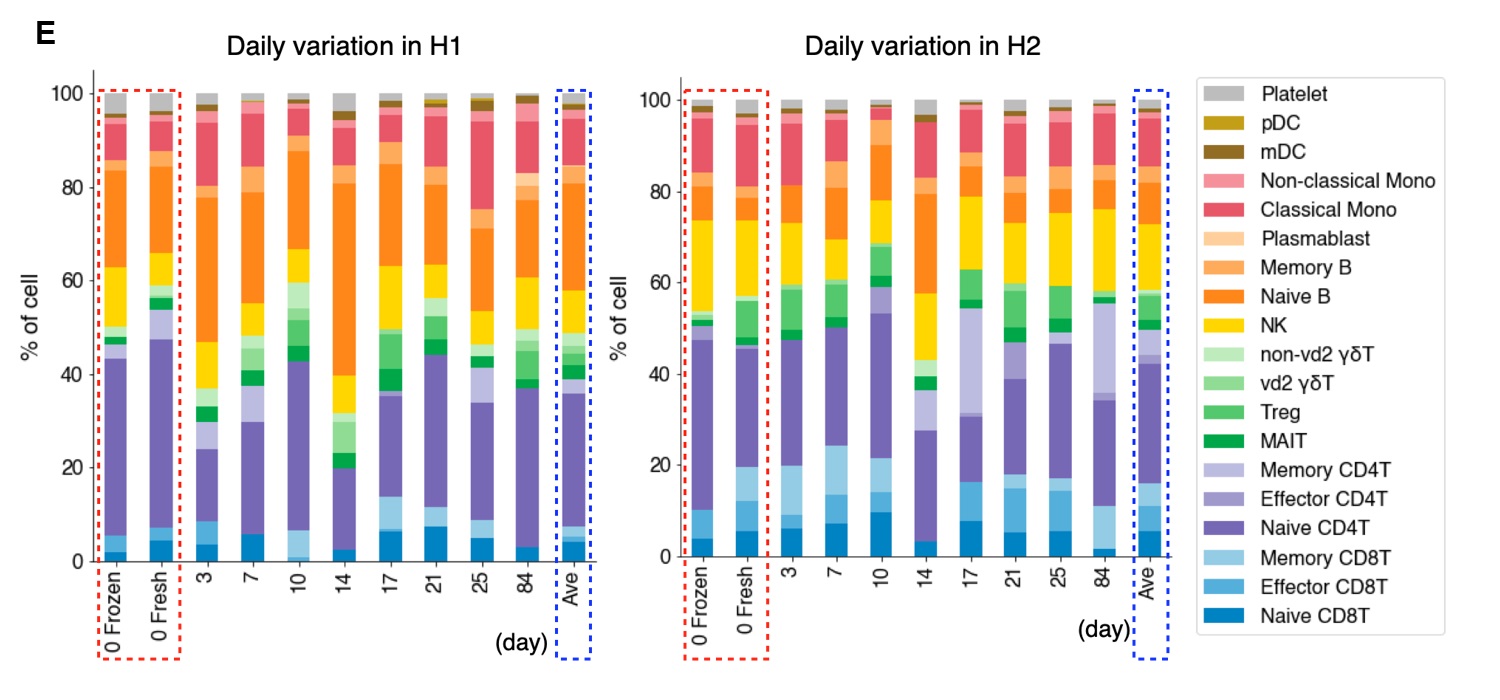
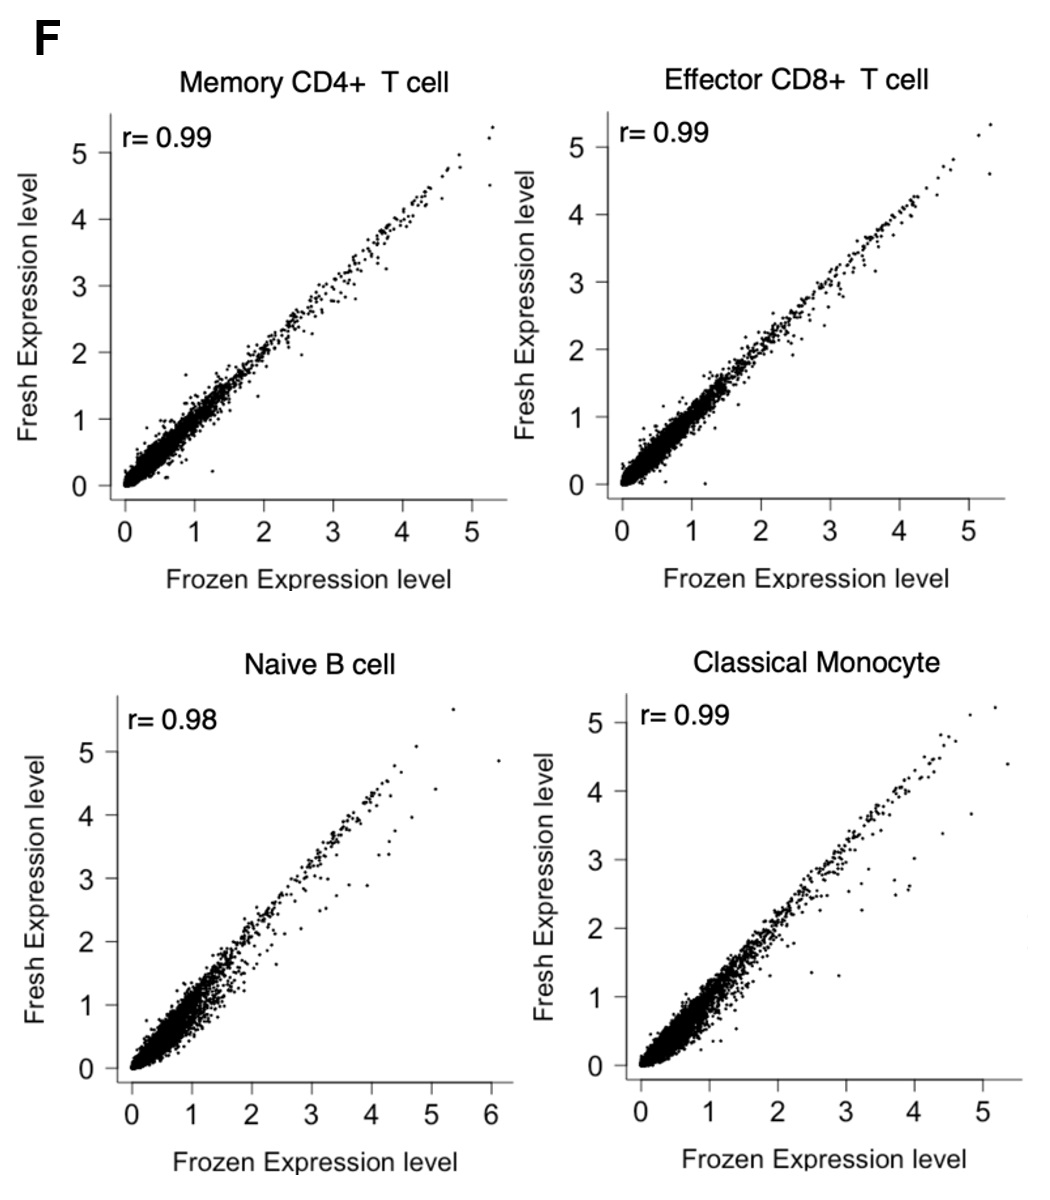
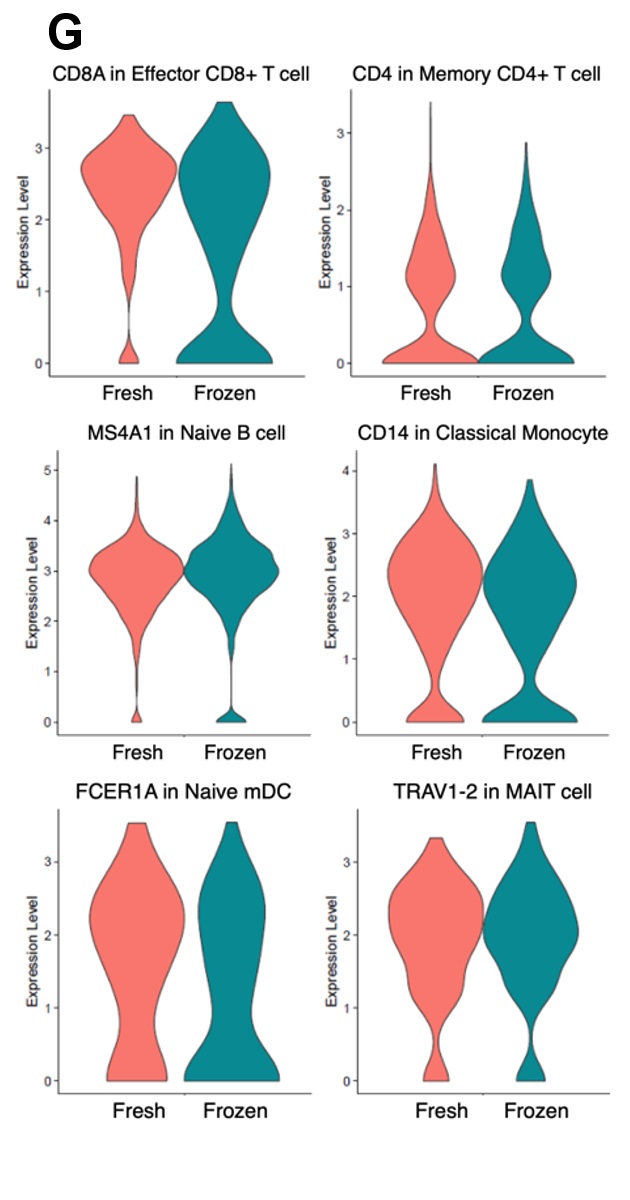
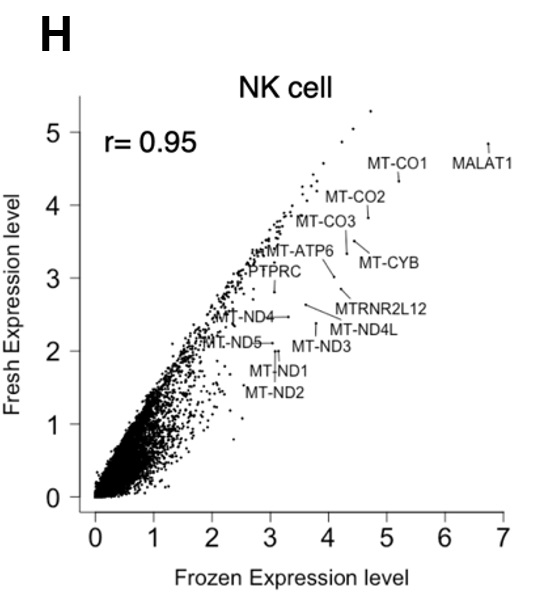
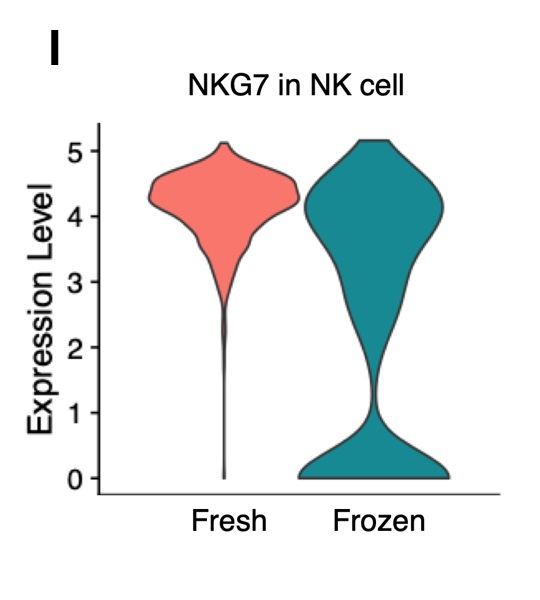
a, Scheme of the current study. For daily variation study, we collect multiple timepoints samples from H1 and H2 at shown time-points. For individual variation study, we collect PBMC samples from seven participants, H1-H8. Using those samples, we analyzed transcriptome, genomes and proteome. b, Evaluation of sample distribution. We used UMAP plot to confirm any batch effect exist. Each point shows cell and colored with 25 cases shown in margin. c, Cell type annotation. UMAP plot showing clusters colored by cell types. d, Expression of representative markers for cell annotation. We used markers below: CD3D, CD8A and CD4 (T cell), TRAV1-2 (MAIT cell), TRGV9 (gd T cell), MS4A1 (B cell), CD14 and FCGR3A (monocyte), NKG7 and KLRF1 (NK cell), PPBP (platelet). e,f, Structure of PBMC in each time point of H1(e) and H2 (f). x-axis shows day after first sampling and y-axis shows percentage of each cell components. Bars with red break line shows data comparison of fresh sample (0F) and frozen sample (0), and blue break line shows average of each person. g,h Evaluation of correlation between fresh and frozen sample. We used H1 day0 fresh and H1 day0 frozen. x-axis shows expression level of frozen sample and y-axis shows expression level of fresh sample. Correlation is shown in each plot (g,h) and outlier genes are also shown in each plot (h). i Expression of representative genes in fresh and frozen samples.
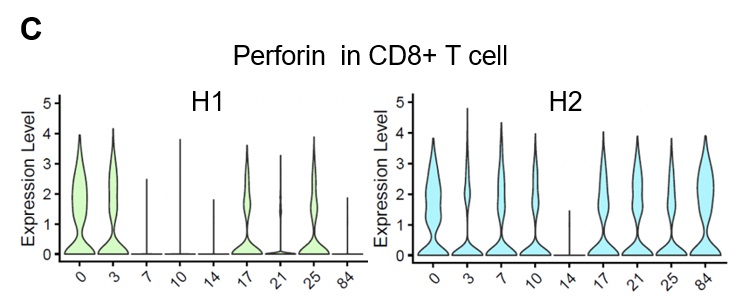
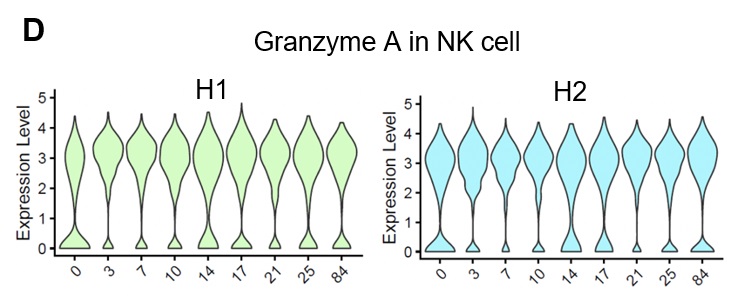
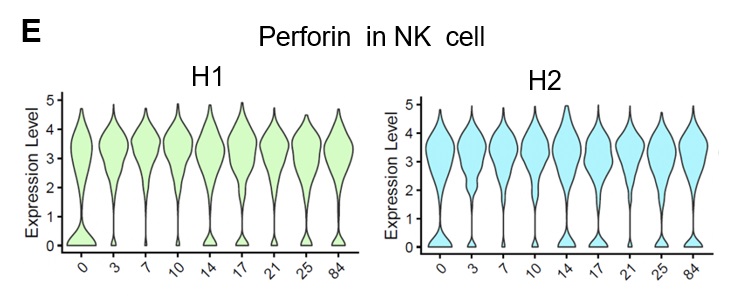
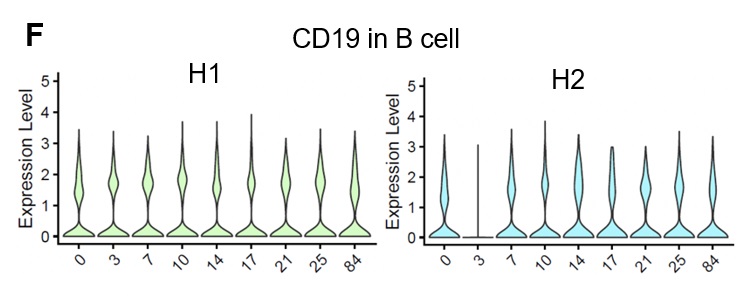
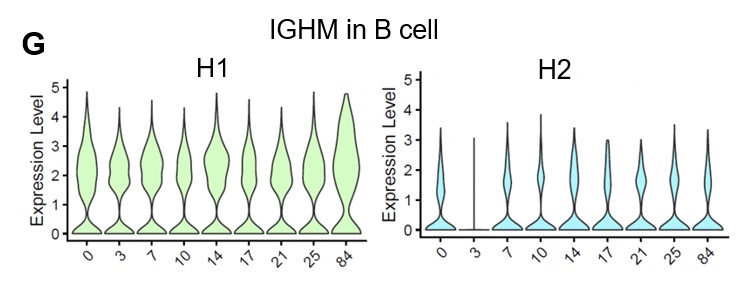
Figure 2. Daily diversity of PBMC profiling in H1 and H2.
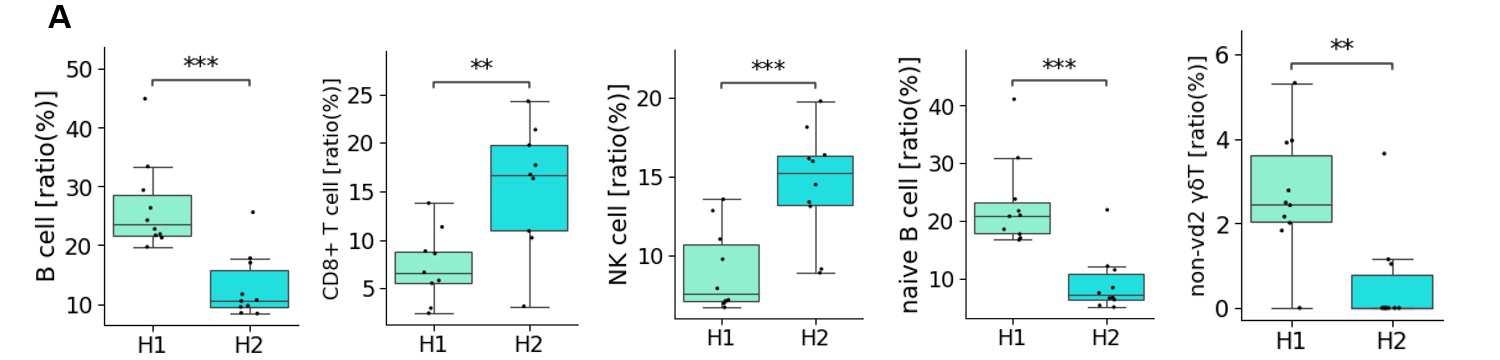
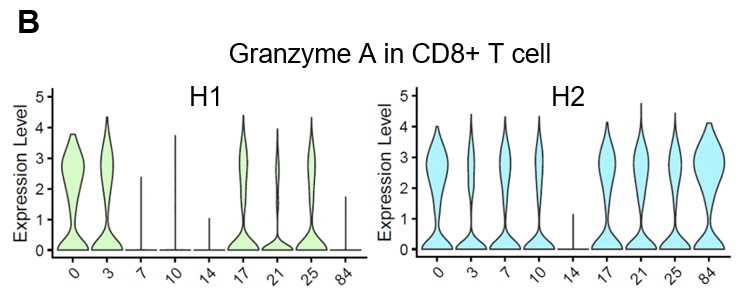
a-e, Ratio of each cell type in H1 (palegreen) and H2 (lightblue). Boxplots includes eight timepoints of each person of B cell (a), CD8+ T cell (b), NK cell (c), naïve B cell (d), non-vd2 gd T cell (e). p-value was calculated by t-test and shown as **: 1.00e-03 < p <= 1.00e-02, ***: 1.00e-04 < p <= 1.00e-03. f, Expression level of representative genes in each cell type of H1 and H2.
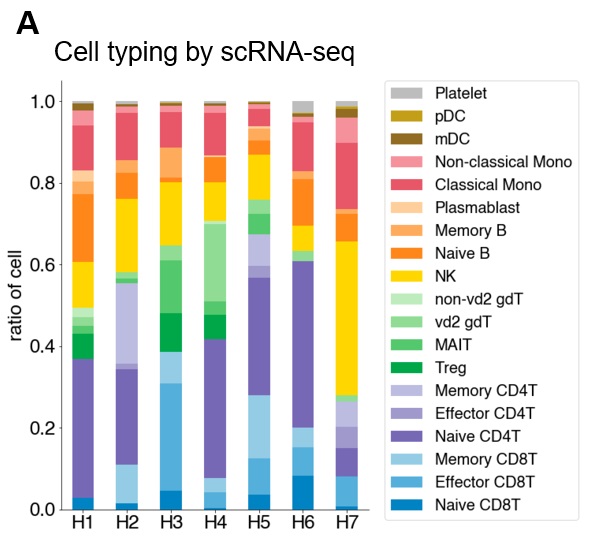
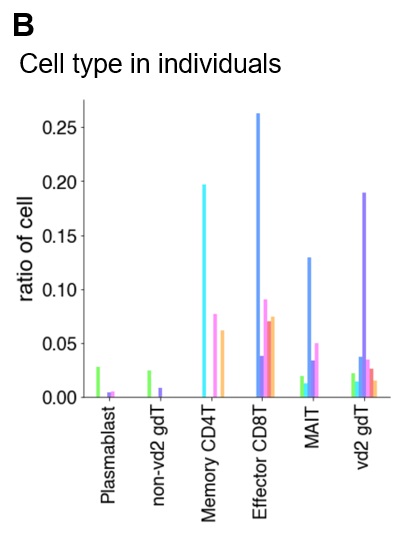
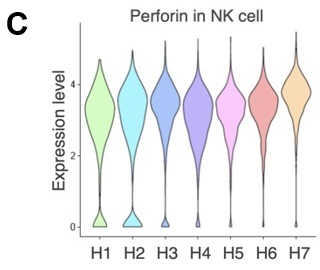
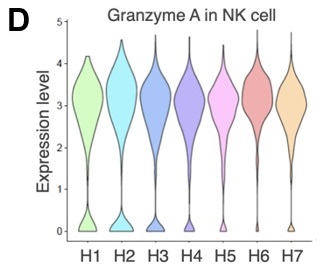
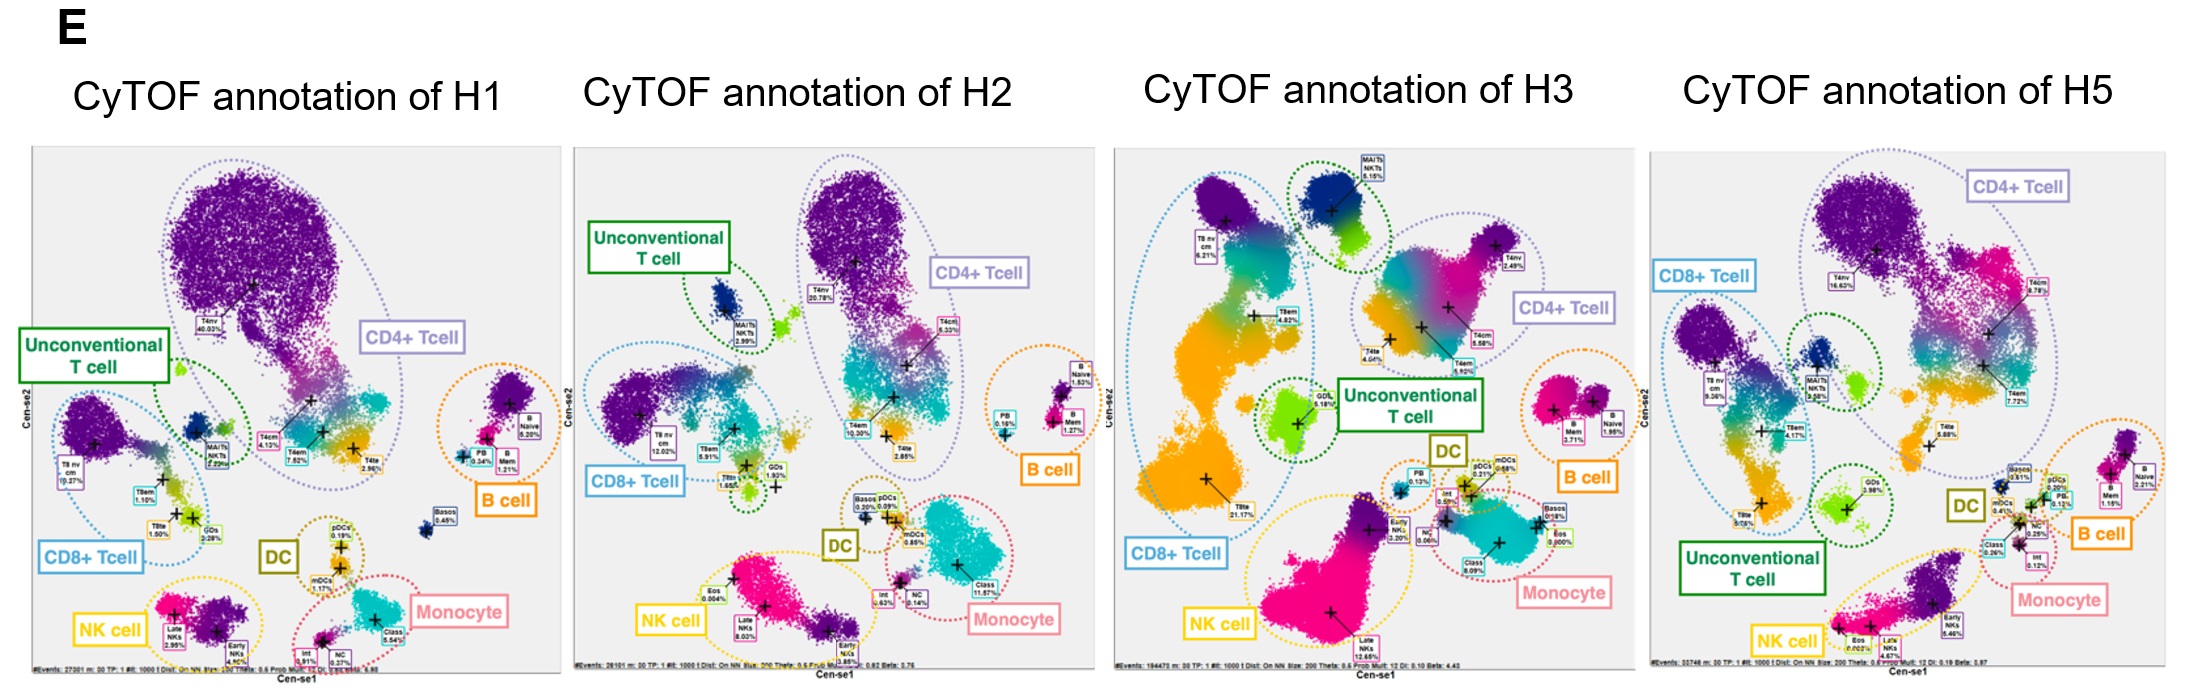
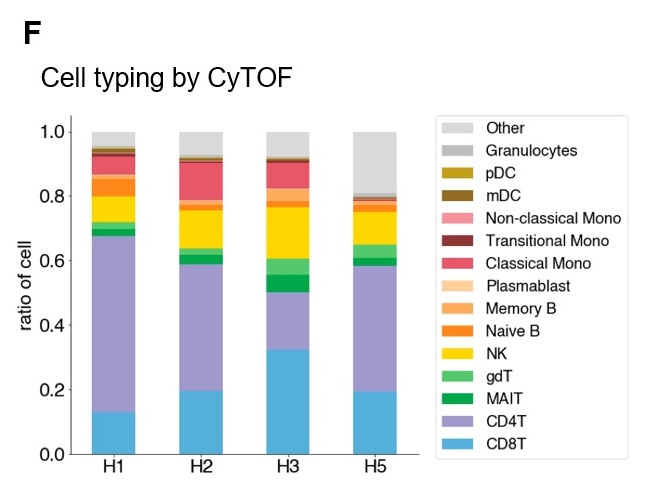
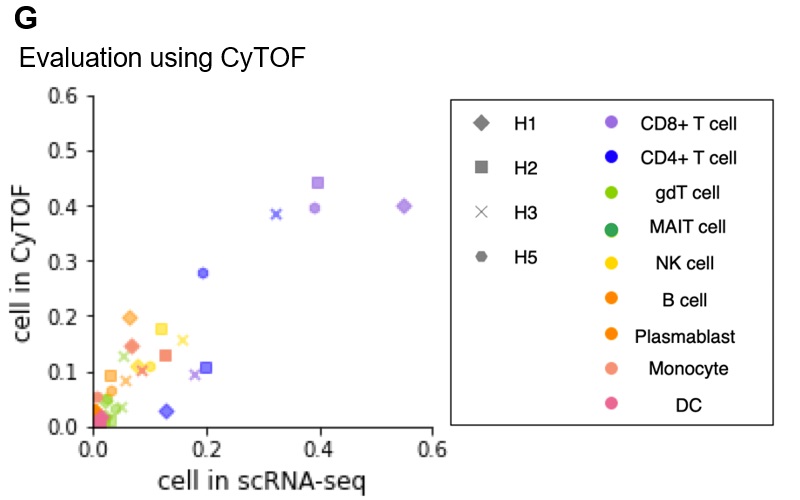
Figure 3. Diversity of PBMC profiling in seven individuals.
a, Structure of PBMC of seven individuals. Cells are annotated based on gene expression dataset analyzed by scRNA-seq. x-axis shows individual and y-axis shows ratio of each cell components. Color legends are shown in margin. b, Individual variance of cell type. x-axis shows focusing cell type and y-axis shows ratio of cell in individuals. c,d , Gene expression level of in seven individuals. Gene and cell type of interest are shown in top of the graph. e, Cell typing using CyTOF of H1, H2, H3 and H5 (from left to right). f, Structure of PBMC based on CyTOF. x-axis shows individual and y-axis shows ratio of each cell type. Color annotations are shown in the margin. g, Method evaluation using CyTOF. Scatterplot showing correlation of ratio of cell annotated by scRNA-seq (x-axis) and by CyTOF (y-axis). Markers are shaped depending on each individual and colored by cell types shown in margin. For H1 and H2 used in figure3, we selected H1_9 and H2_9 as representative sample.
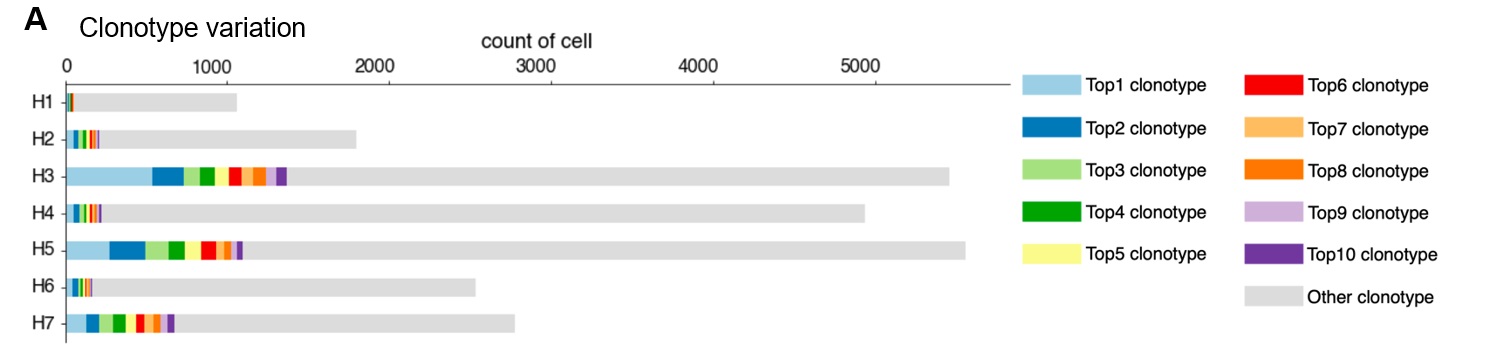
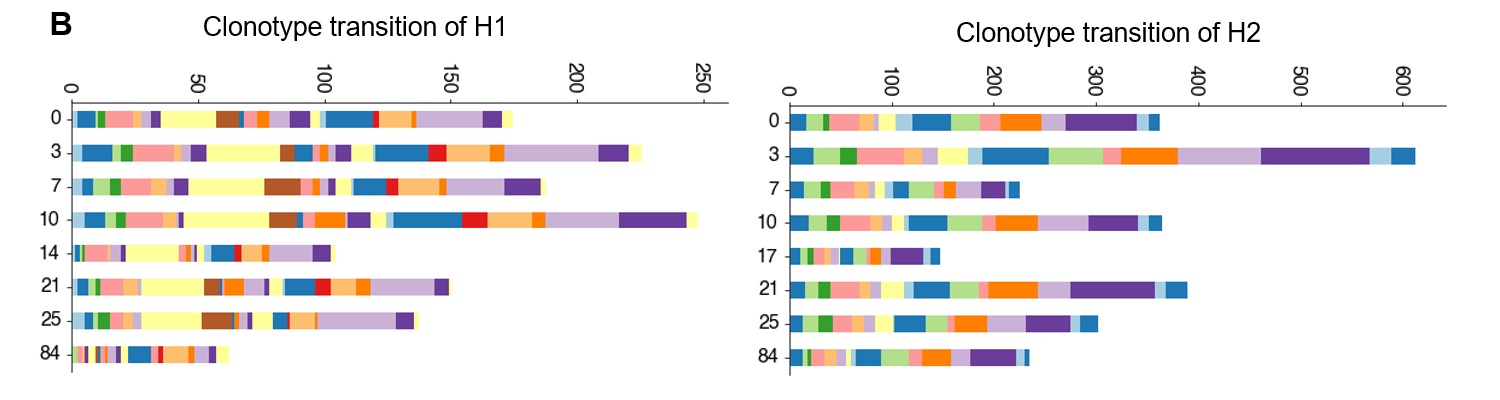
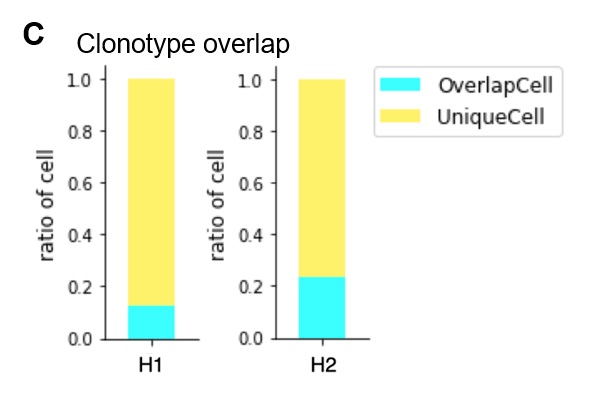
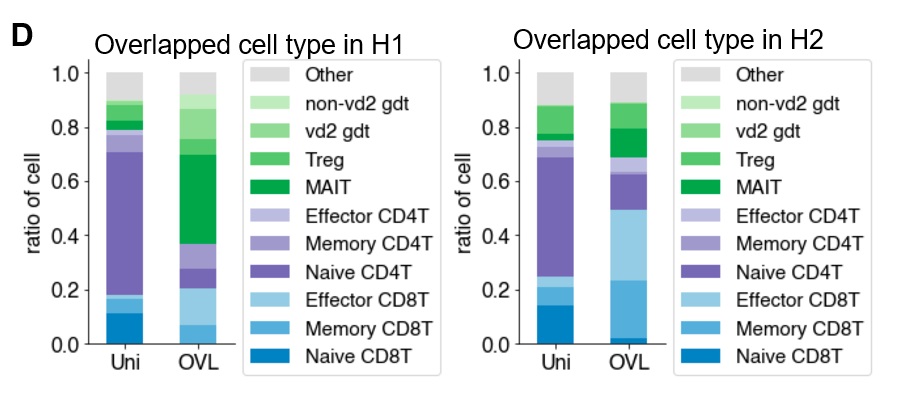
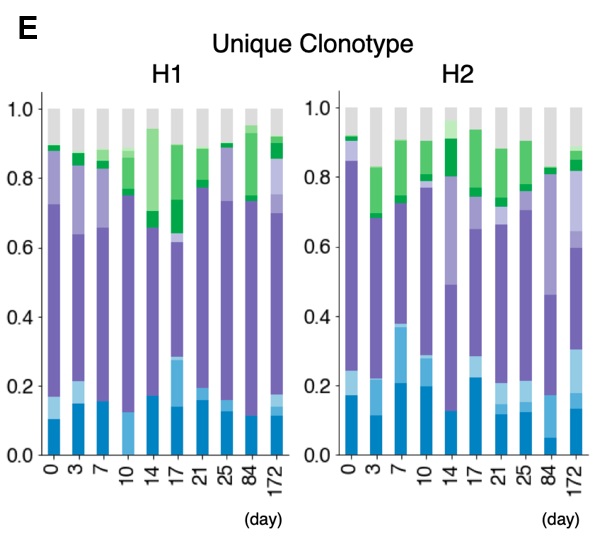
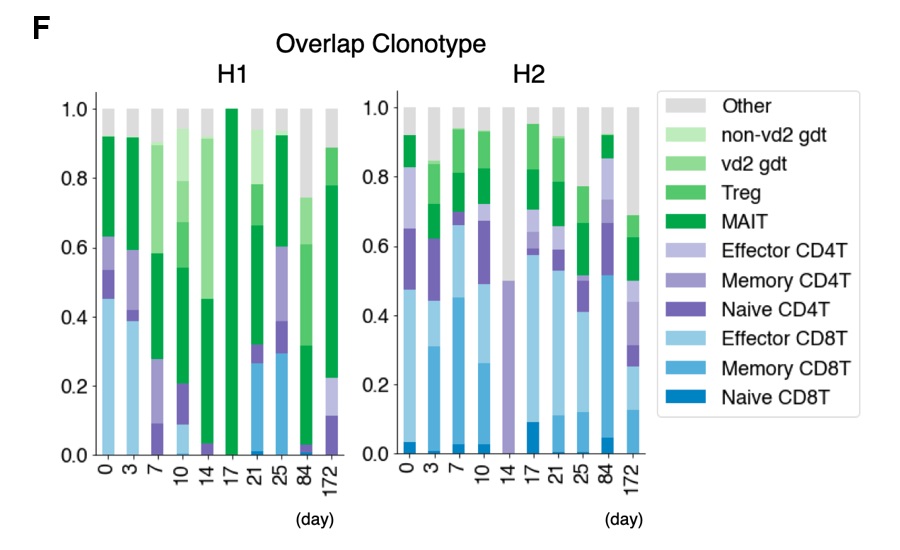
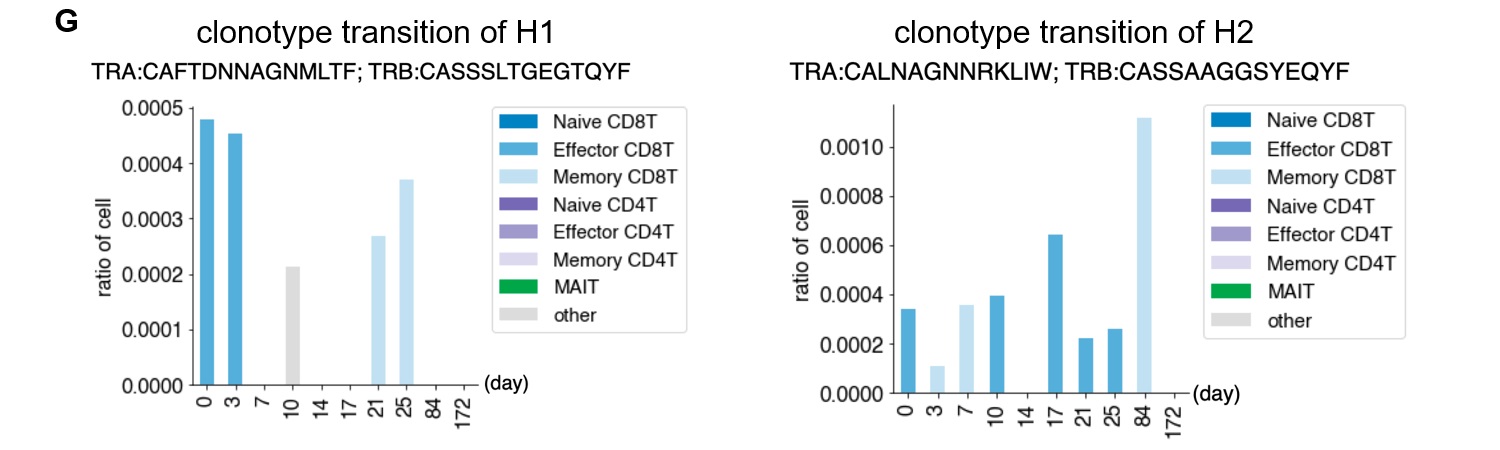
Figure 4. TCR individual and daily variation.
a, Clonotype divergence between seven individuals. x-axis shows number of T cell and y-axis shows individual. Cell with top1 – top10 clonotypes are plotted as specific colors shown in margins. Shown top clonotypes are not common between individuals. b, c, Clonotype divergence of nine timepoints of H1(b) and H2 (c). In barplot, clonotypes which ranked as top1 – top10 in somewhere timepoints are shown. Color in H1 and H2 is not common. d, Barplot showing ratio of T cell with unique TCR (light blue) and overlapped TCR (yellow) in H1 (left) and H2 (right). e,f, Barplot showing ratio of detailed T cell type in unique (left) and overlapped (right) of H1 average (e) and H2 average (f). g,h, Barplot showing ratio of detailed T cell type in unique (g) and overlapped (h) of H1 (left) and H2 nine timepoints (right). i,j, Barplot showing ratio of T cell in each timepoint with specific clonotype TCR of H1 (i) and H2 (j). Information of TCR is shown in the top of each graph.
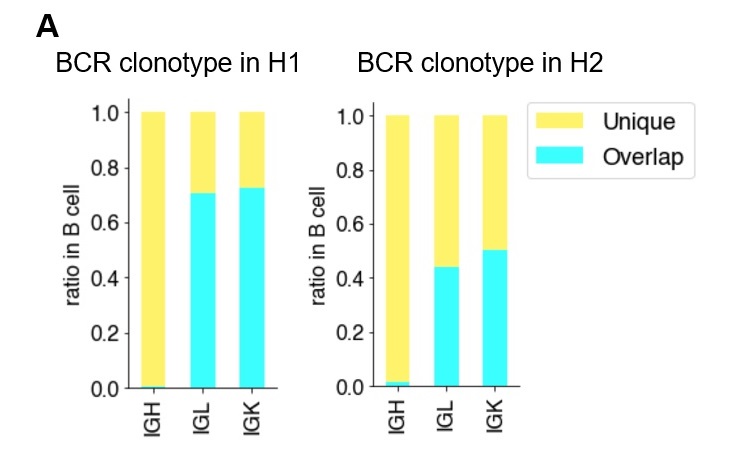
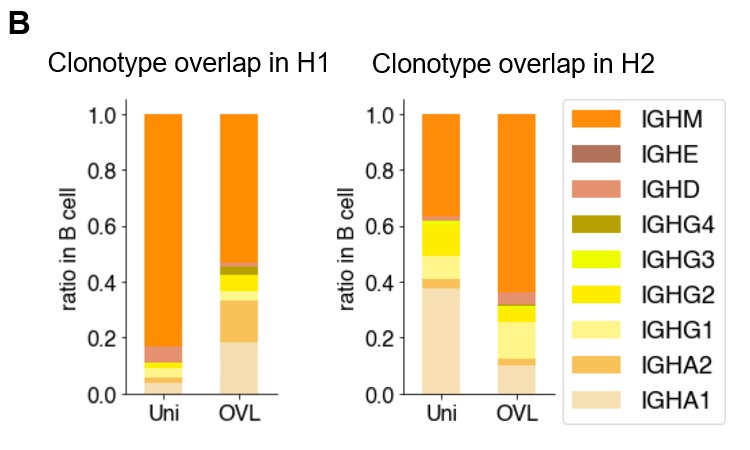
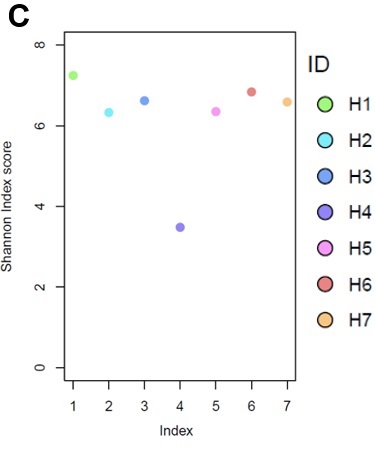
Figure 5. Individual variation and Daily variation of BCR.
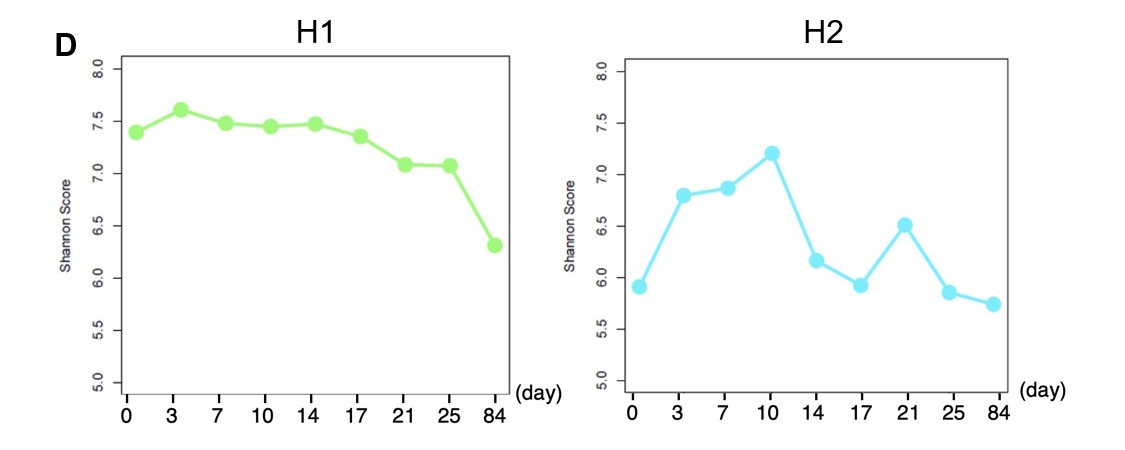
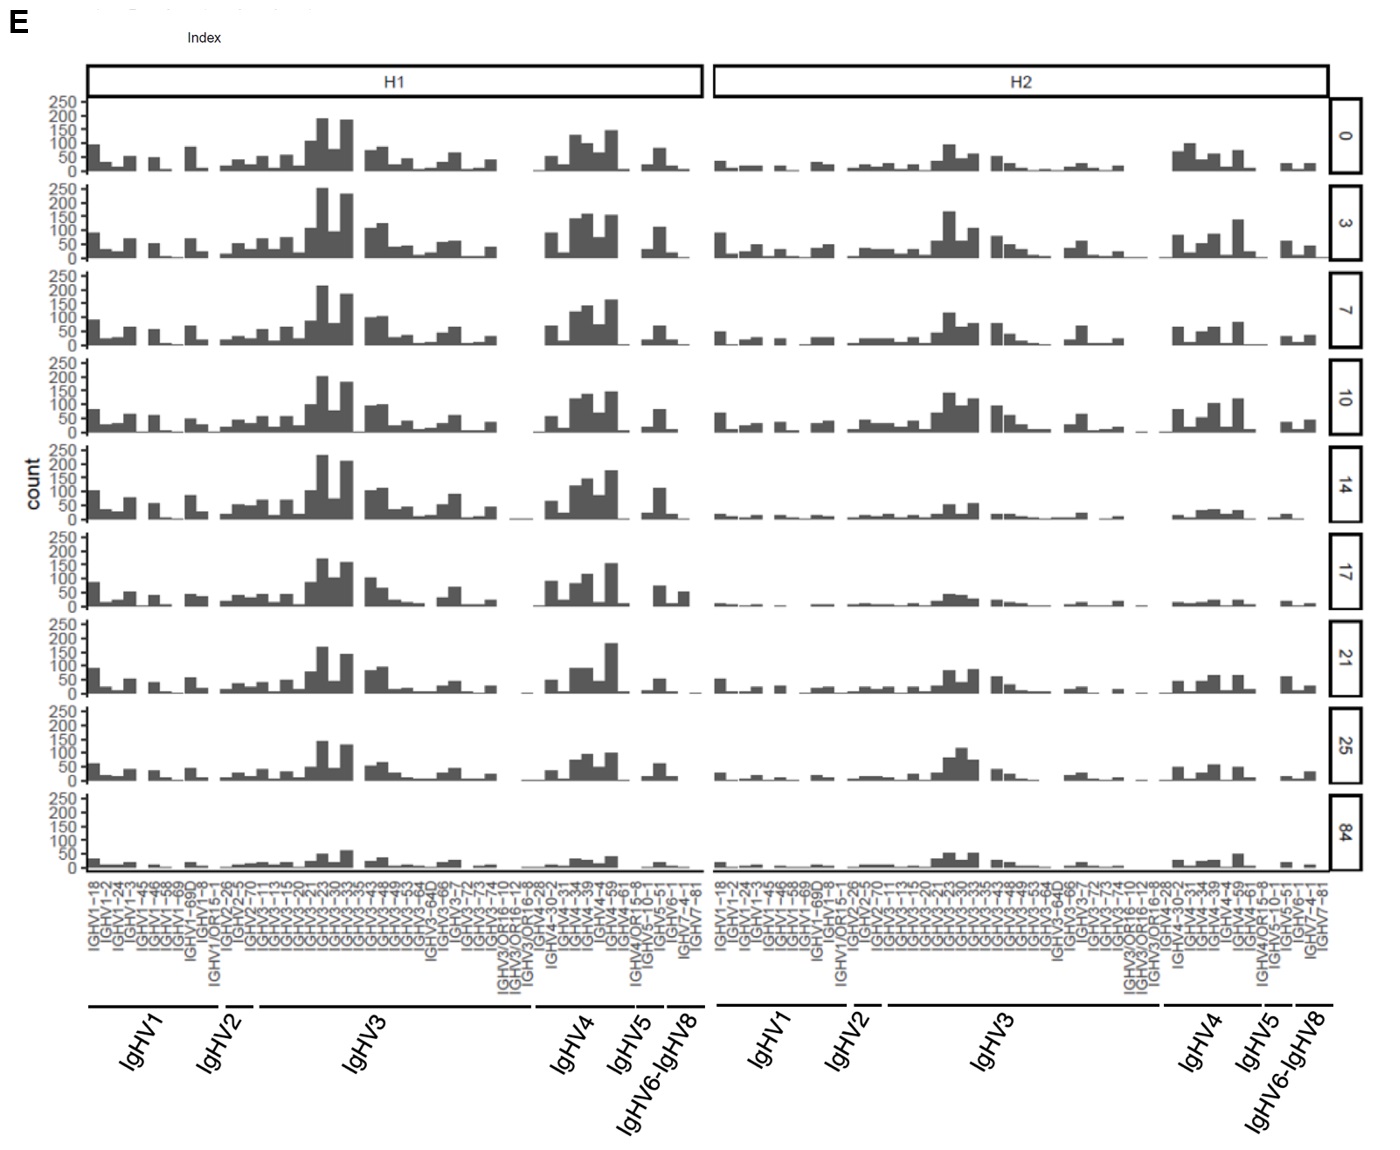
a, BCR Clonotype divergence in H1. Barplot showing ratio of overlapped (paleblue) and unique (light yellow) clonotype of IgH, IgL and IgK. b, Ratio of each clonotype of unique(left) and overlap(right) in H1. c, Shannon index score variation of BCR in H1 -H7. Color legend is shown in the margin. For H1 and H2, we used average score of day0 to day84. d, Daily variation of Shannon index score of BCR daily variation in H1. x-axis shows timepoint and y-axis shows Shannon score. e, Variation of V gene in BCR from day0 to day84 (top to bottom) in H1 (left) and H2 (right).
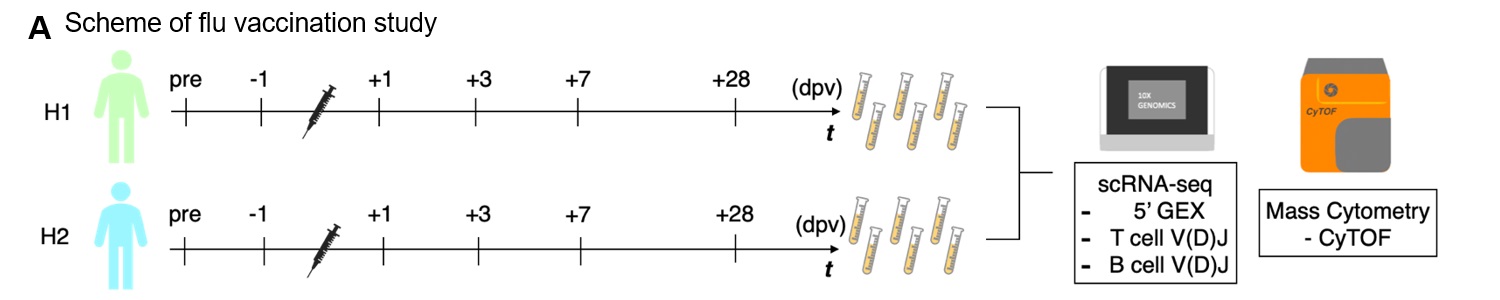
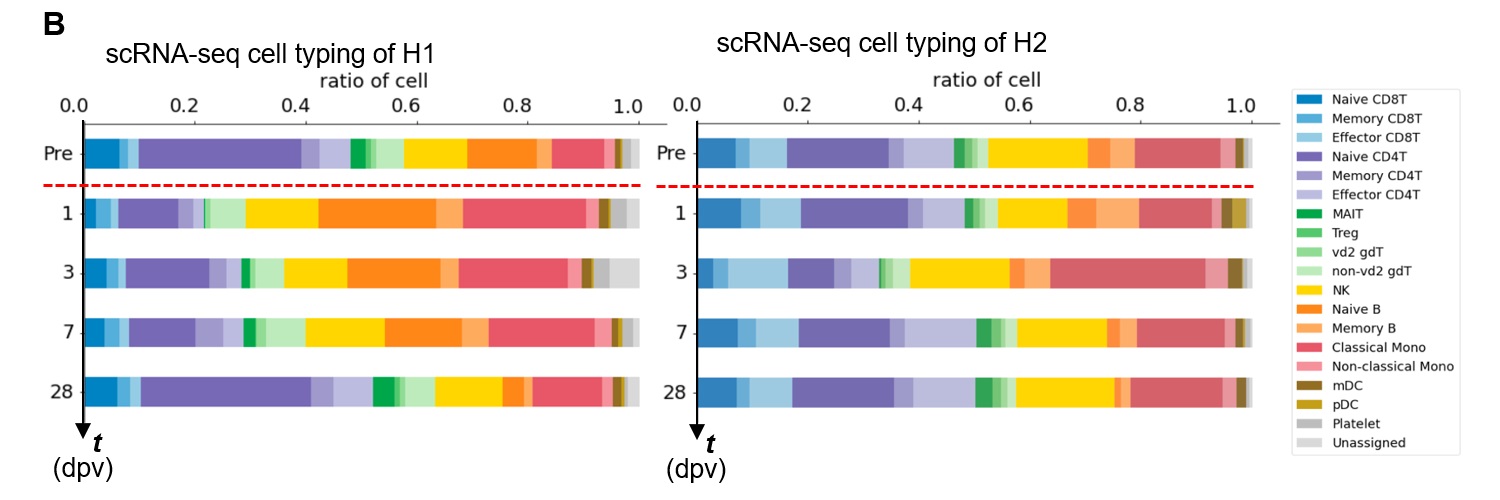
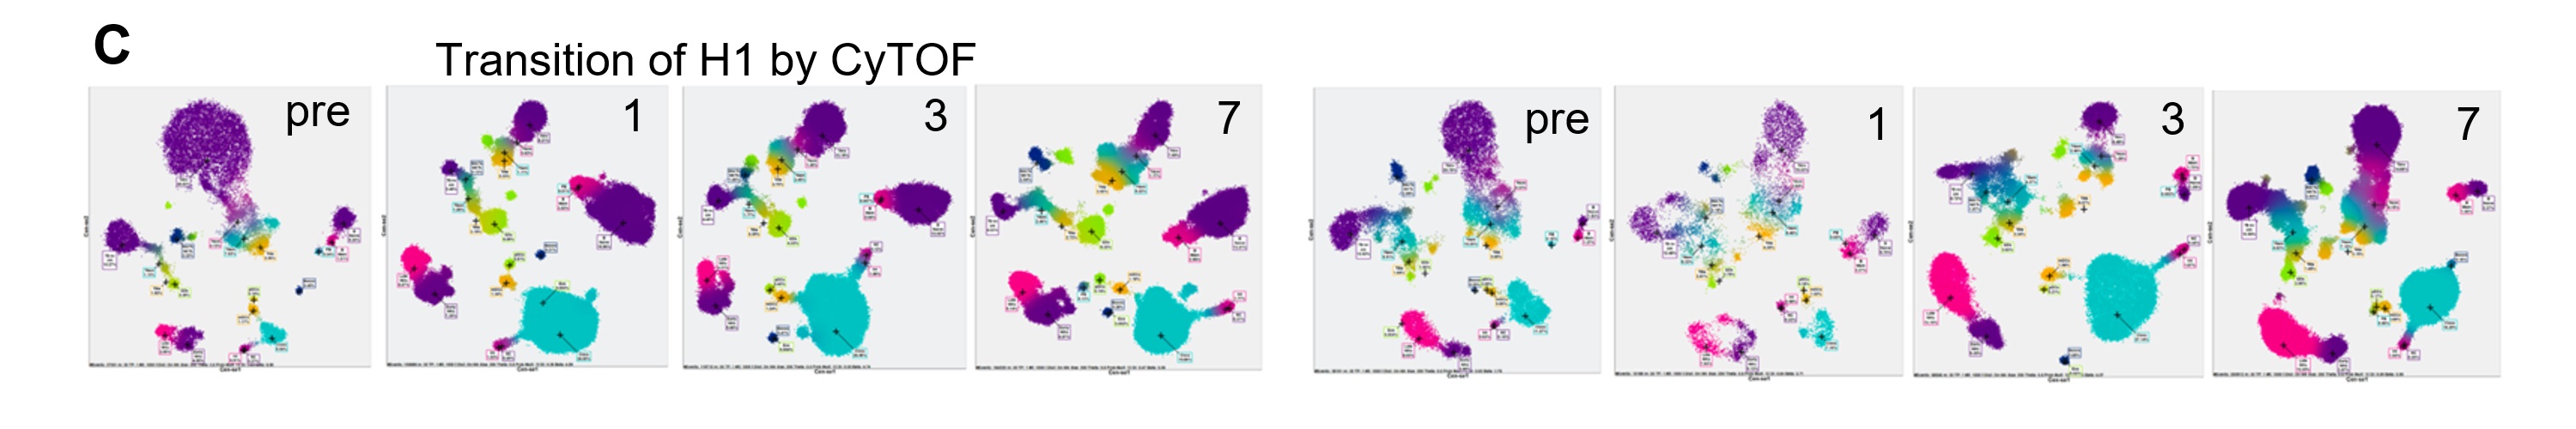
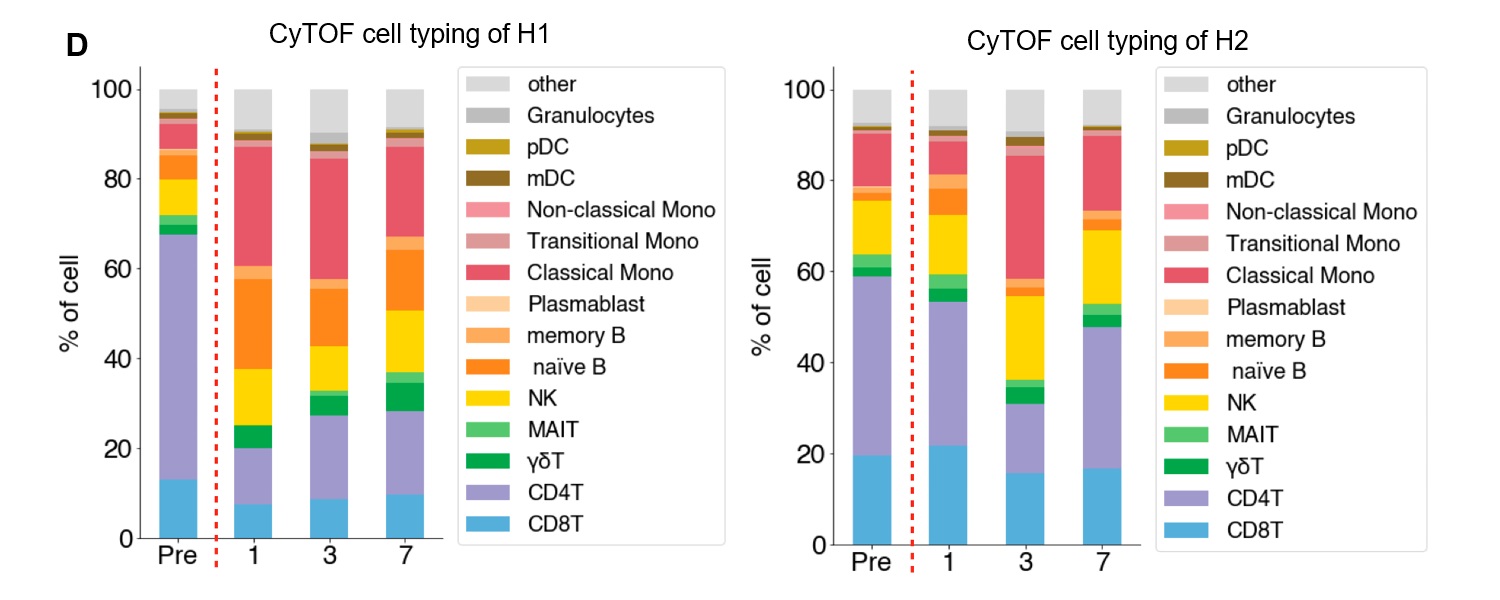
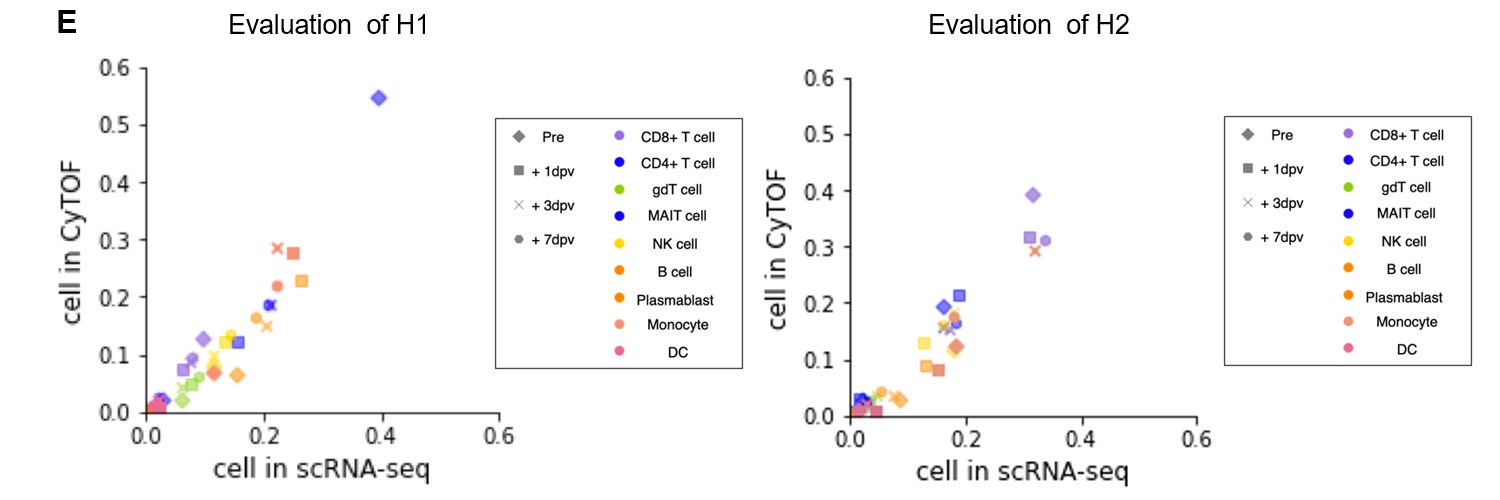
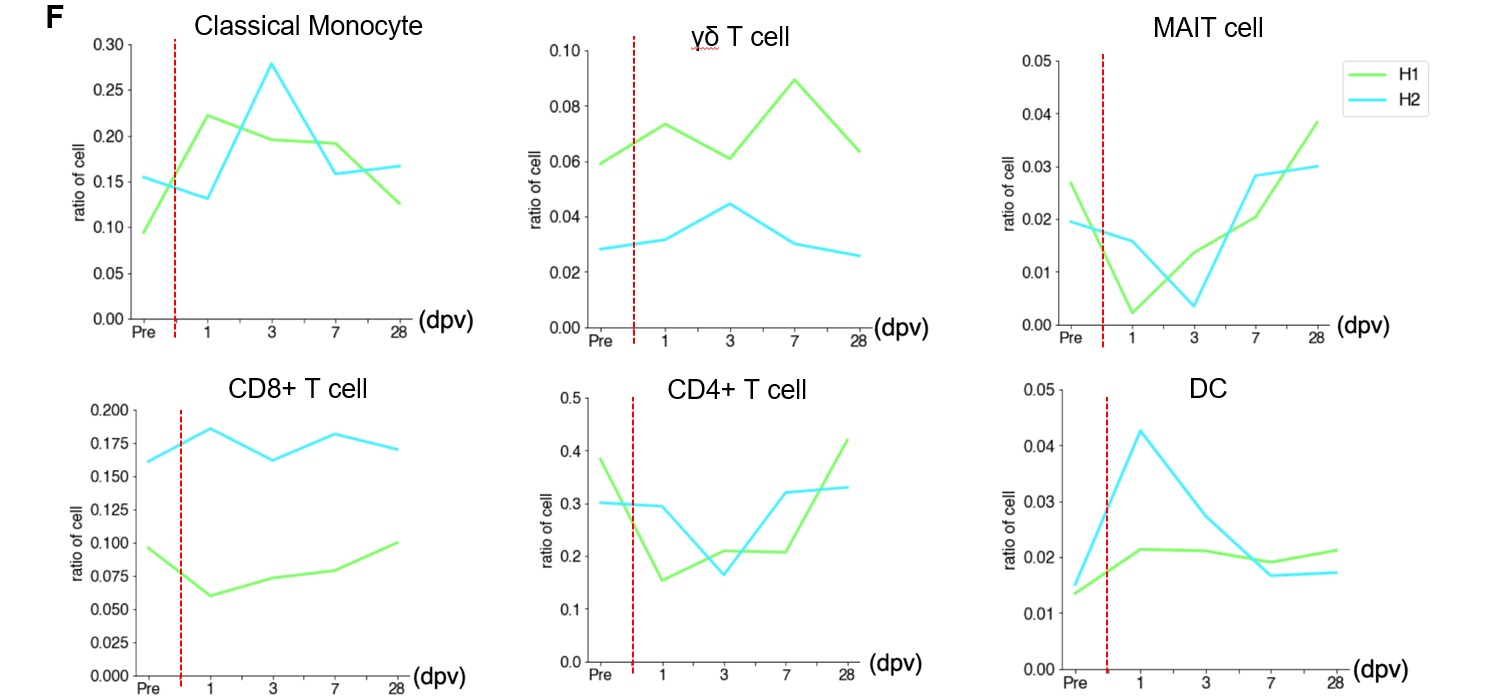
Figure 6. Perturbation of the immune cell gene expression profiles depending on influenza vaccination.
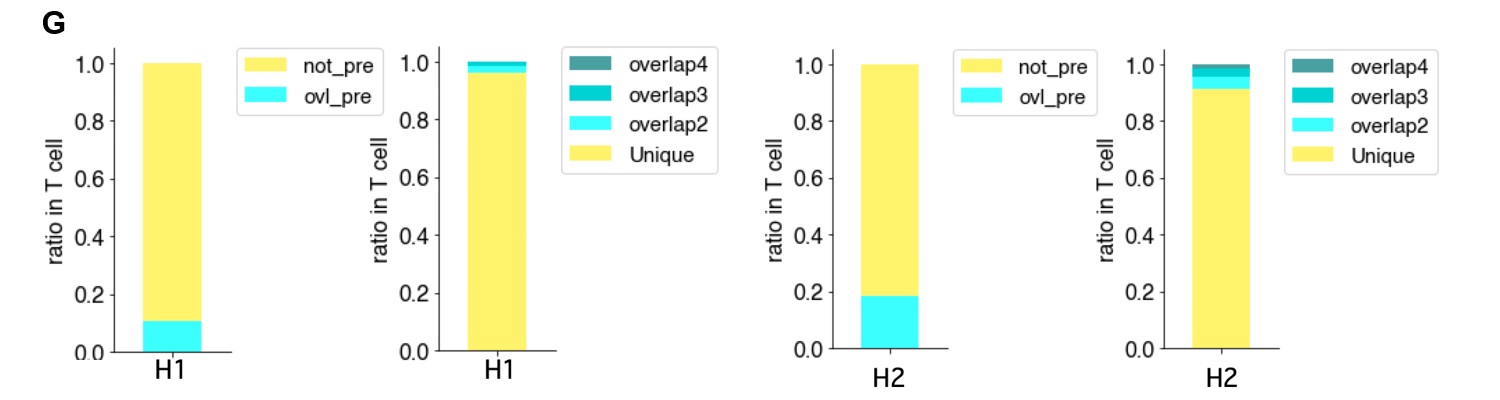
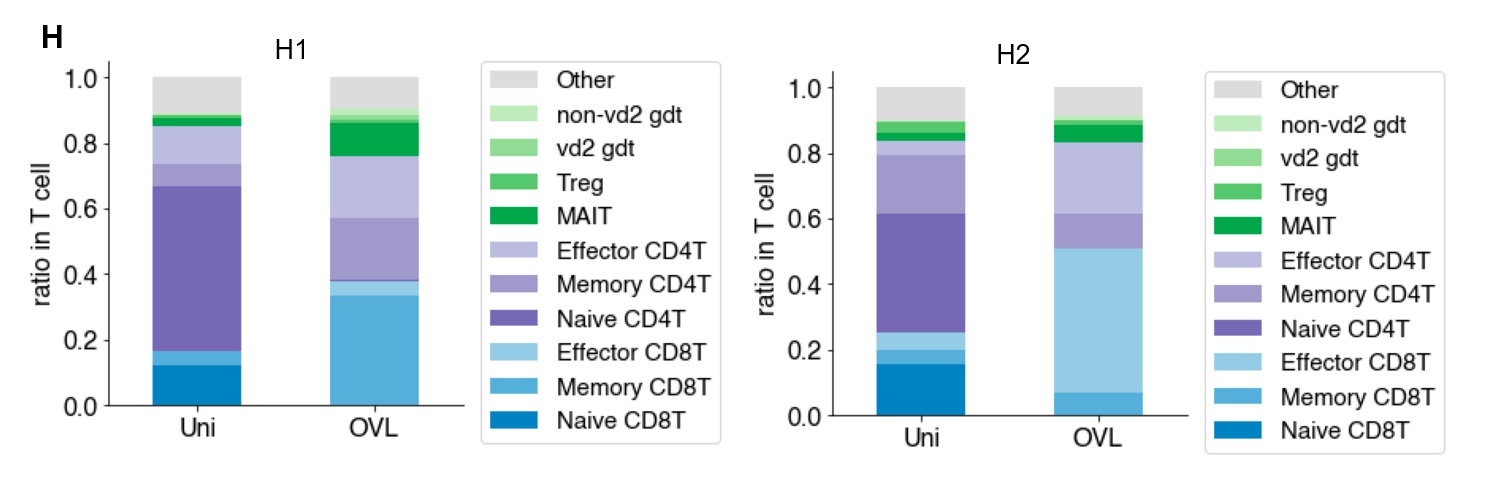
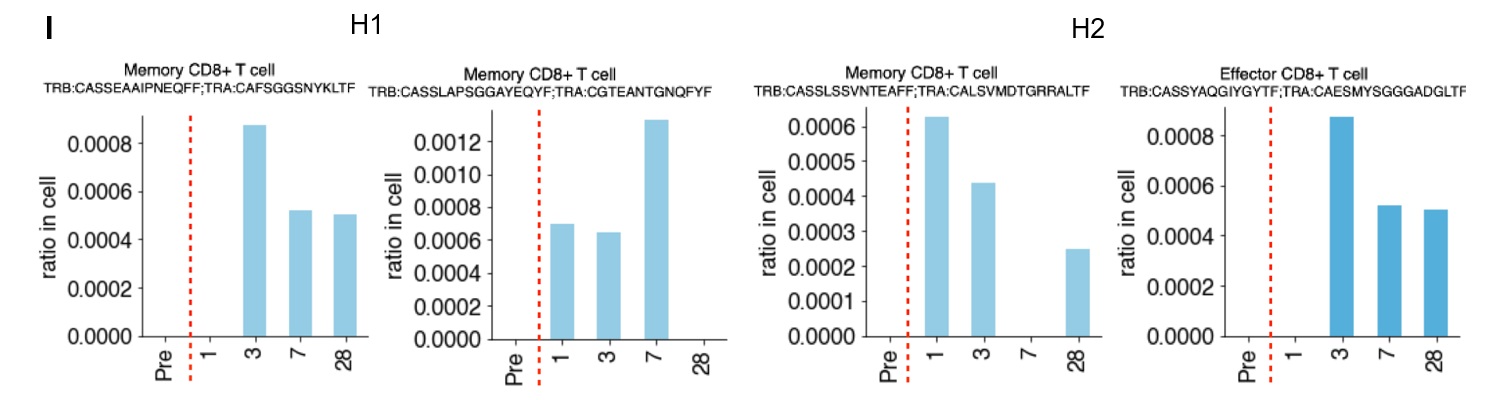
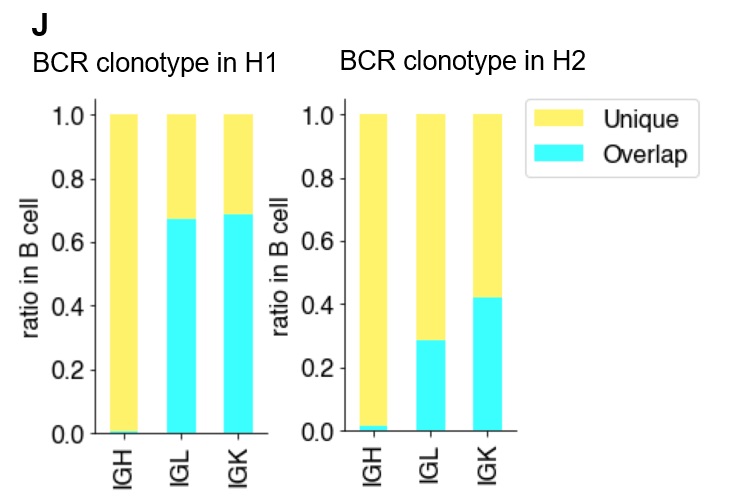
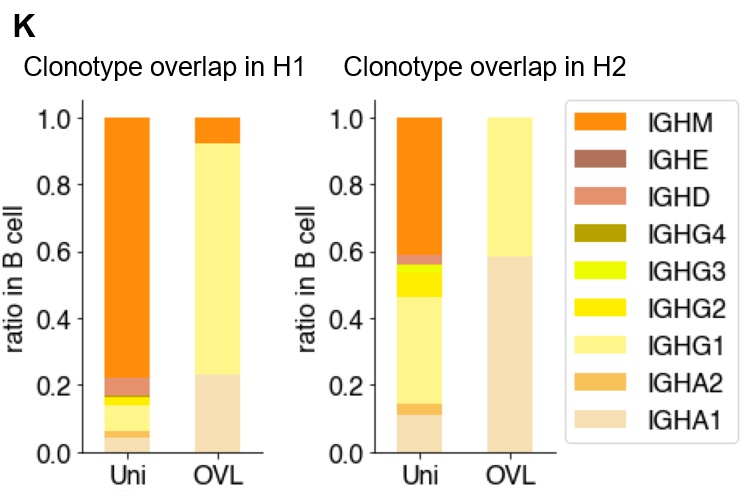
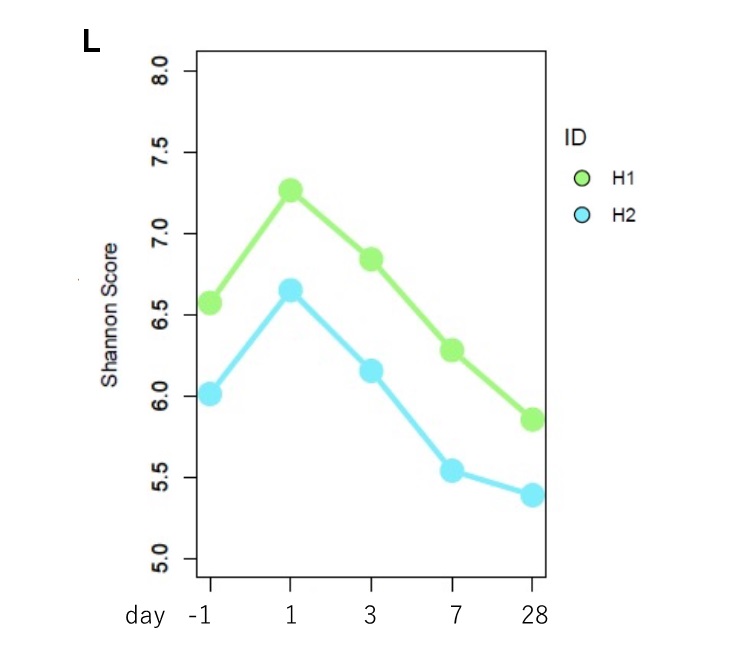
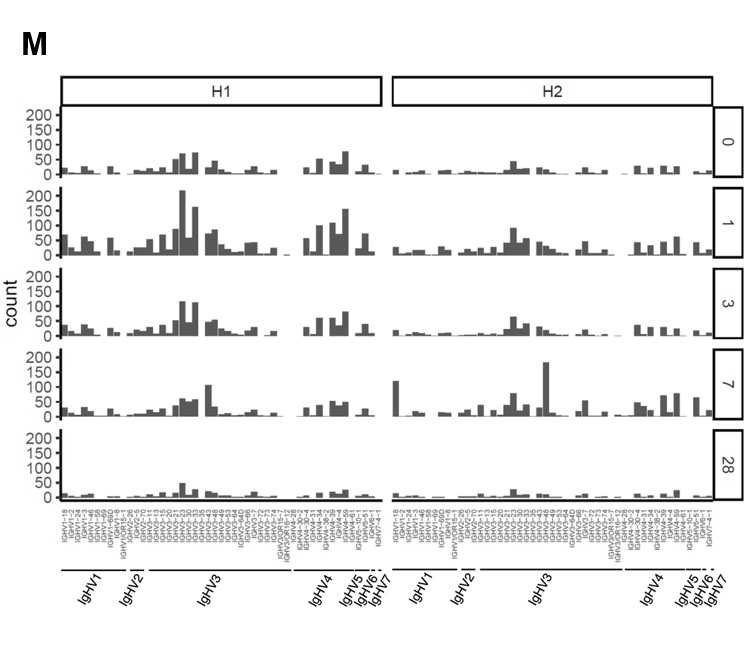
a, Scheme of the influenza vaccination study. We collected blood samples from H1 and H2 in pre-vaccination, one day before vaccination (-1 dpv, day post vaccination), 1, 3, 7 and 28 dpv. We analyzed PBMCs transcriptome, V(D)J of BCR and TCR in single-cell level using 10x Genomics, proteomics in single-cell level using Fluidigm CyTOF. b,c Barplot showing transition of cell components before and after influenza vaccination of H1 (b) and H2 (c) analyzed by scRNA-seq. d,e, Cen’s plot showing the transition of cell components analyzed by CyTOF of H1 (d) and H2 (e) in pre, 1, 3, 7 dpv. f,g, Barplot showing the transition of cell components analyzed by CyTOF of H1 (f) and H2 (g) in pre, 1, 3, 7 dpv. Color annotations are shown in the margin (left). h,i, Scatterplot showing correlation of ratio of cell annotated by scRNA-seq (x-axis) and by CyTOF (y-axis). Markers are shaped depending on timepoint and colored by cell types shown in margin. j, Transition of ratio of cell type shown in lineplot. x-axis shows day post vaccination and y-axis shows ratio of cell in each person. k,l, Barplot showing ratio of T cell with unique TCR (light blue) and overlapped TCR (yellow) in H1 (k) and H2 (l). m,n, Barplot showing ratio of detailed T cell type in unique and overlapped of H1 average (m) and H2 average (n). o,p, Barplot showing ratio of T cell with specific clonotype TCR of H1(o) and H2 (p) in each timepoint. x-axis shows day post vaccination and y-axis shows ratio of the specific T cell. Information of TCR clonotype is shown in the top of each graph. q, BCR Clonotype divergence in H1. Barplot showing ratio of overlapped (paleblue) and unique (light yellow) clonotype of IgH, IgL and IgK. r, Ratio of each clonotype of unique(left) and overlap(right) in H1. s, Diversity of gene in BCR from -1dpv to 28 dpv (top to bottom) in H1 (left) and H2 (right). t, Ratio of averaged clonotype of unique(left) and overlap(right) in H1 during influenza vaccination.
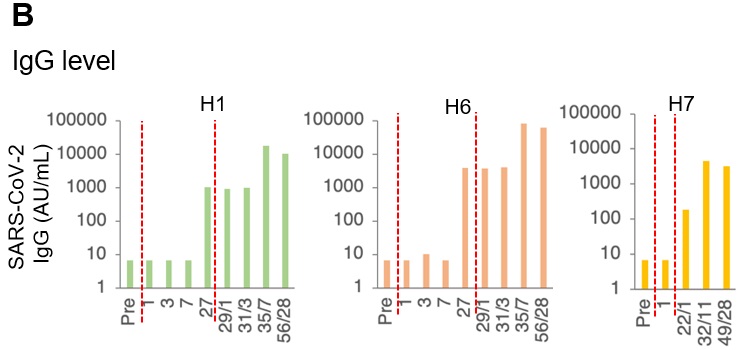
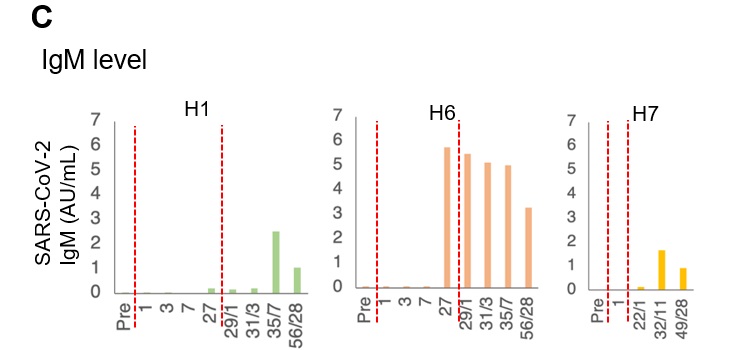
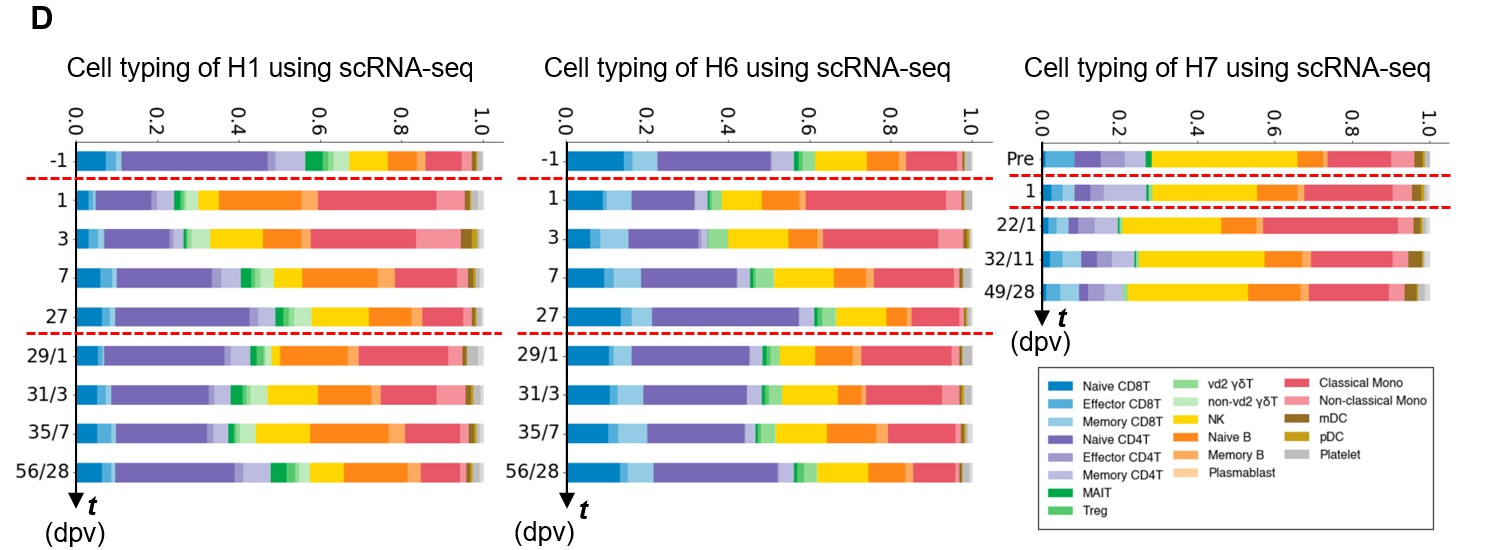
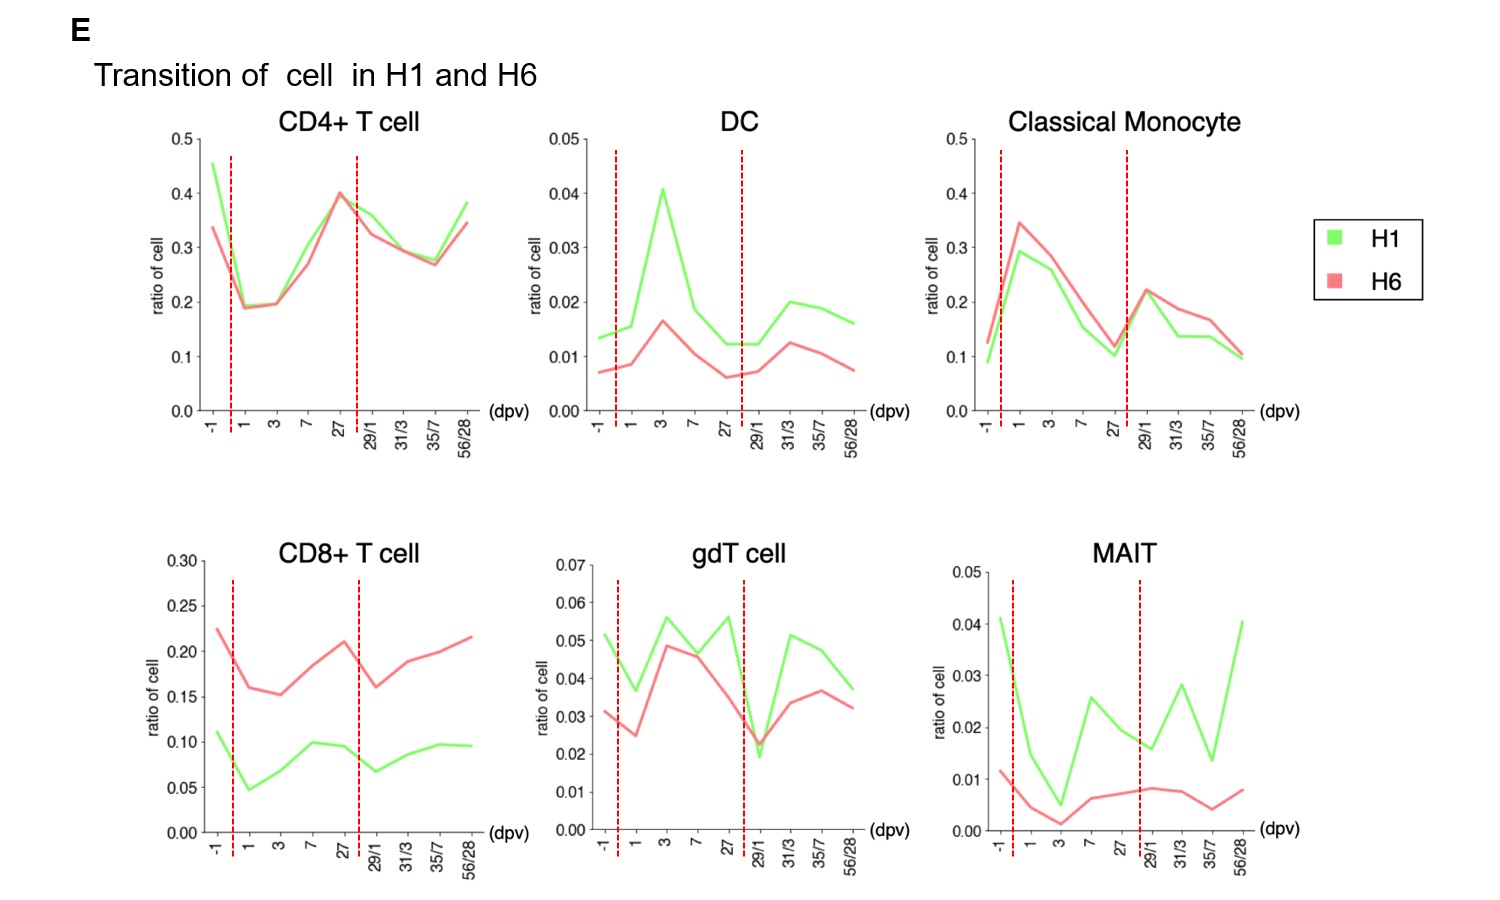
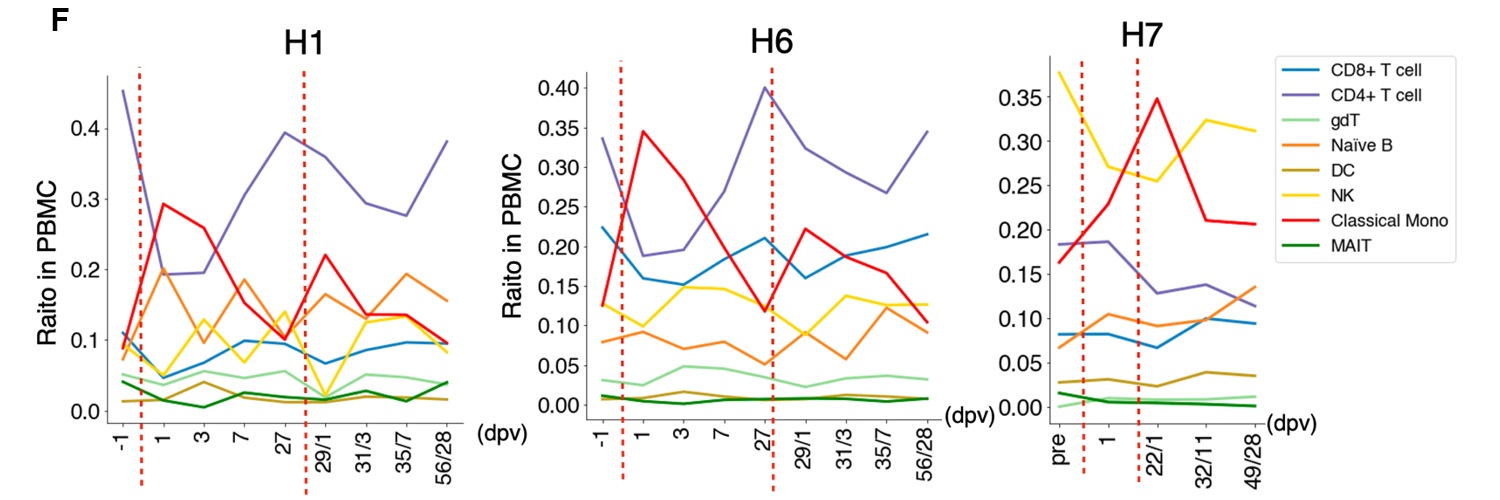
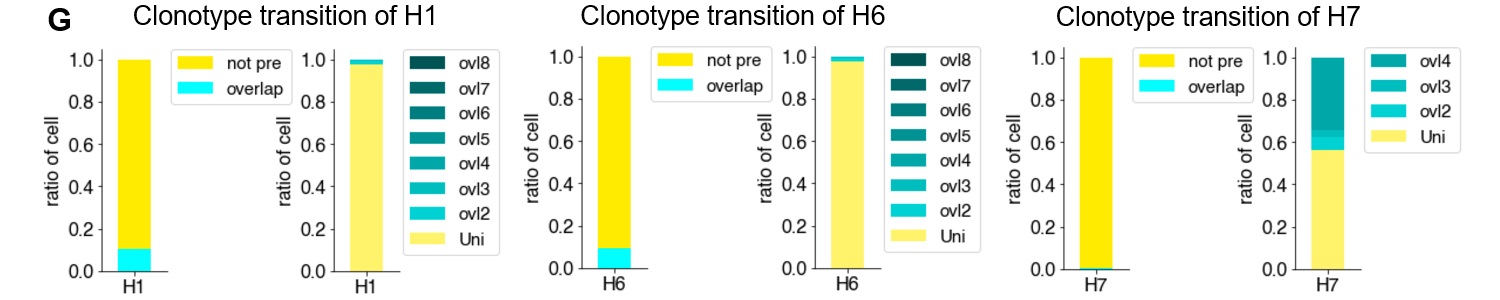
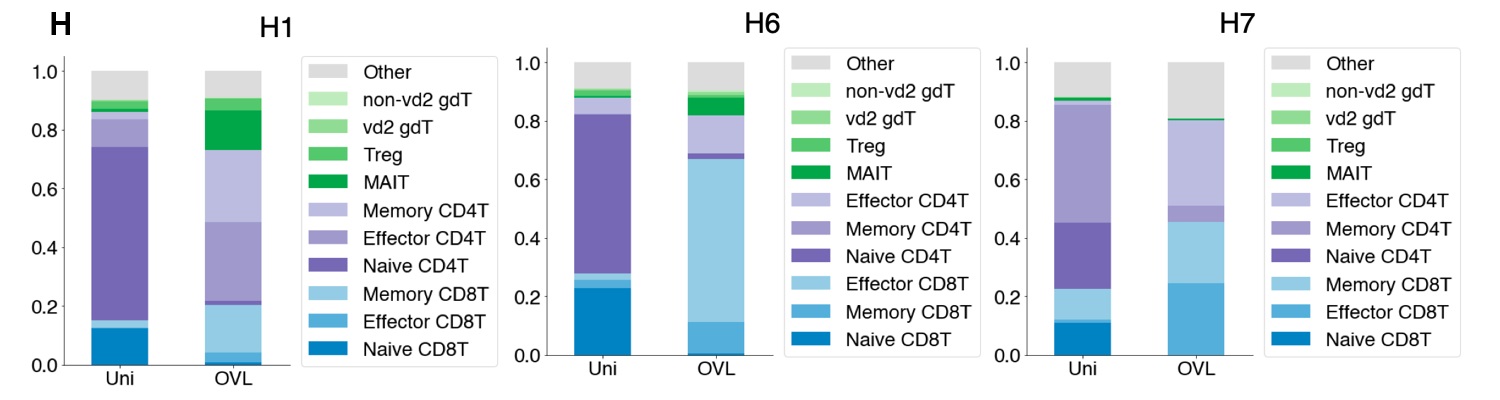
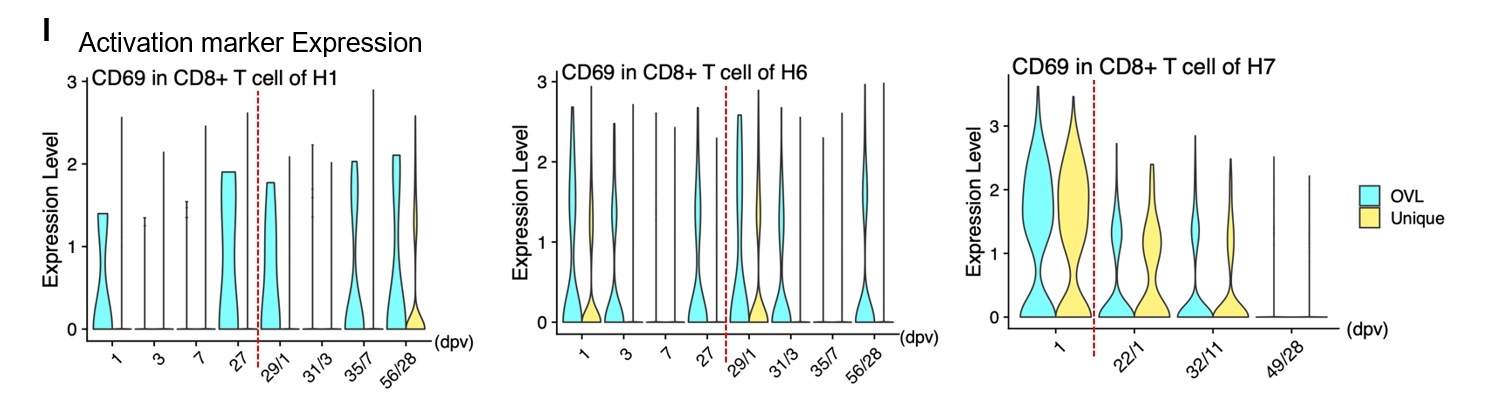
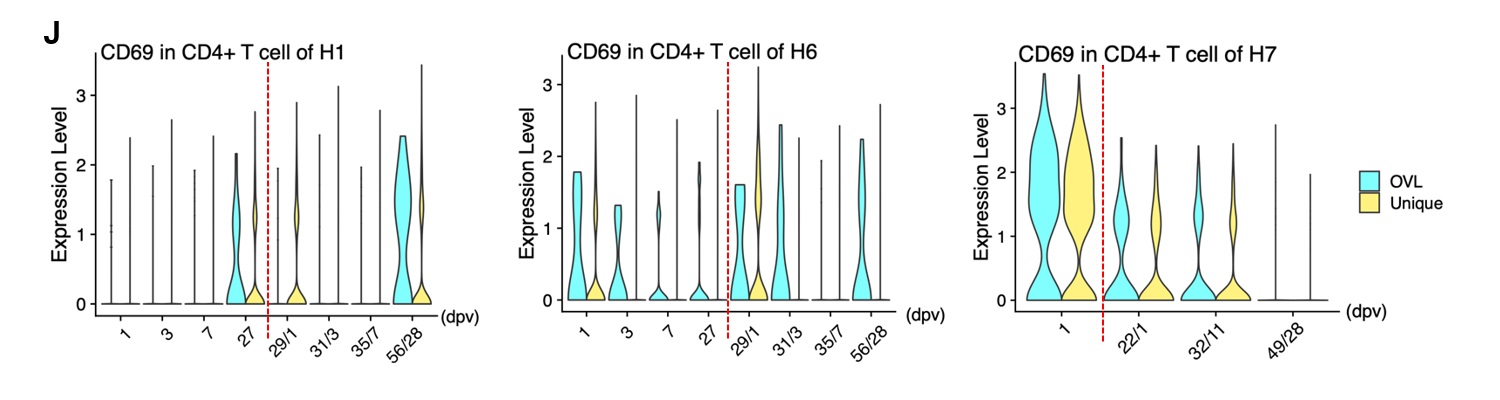
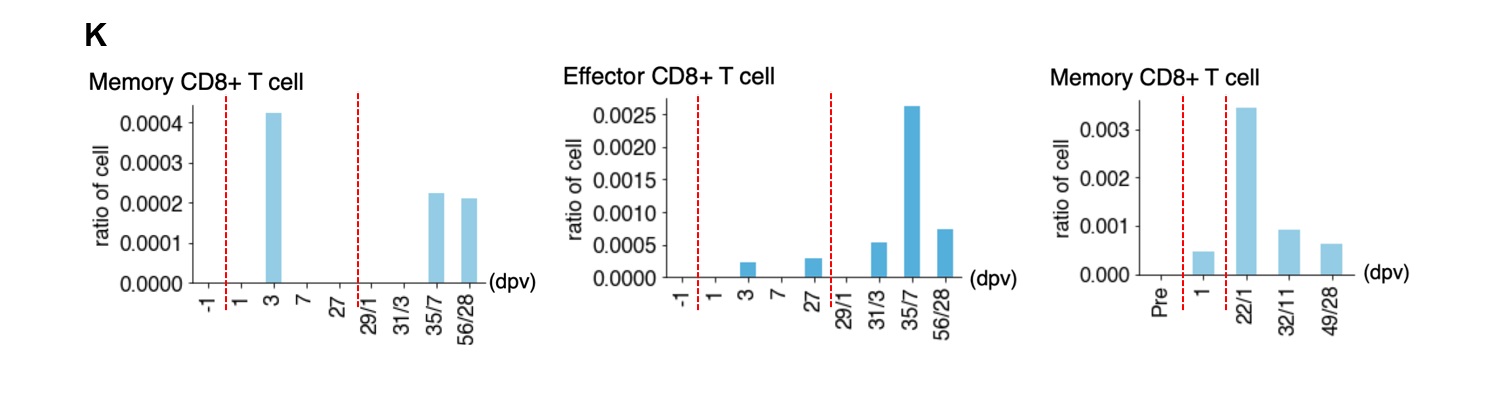
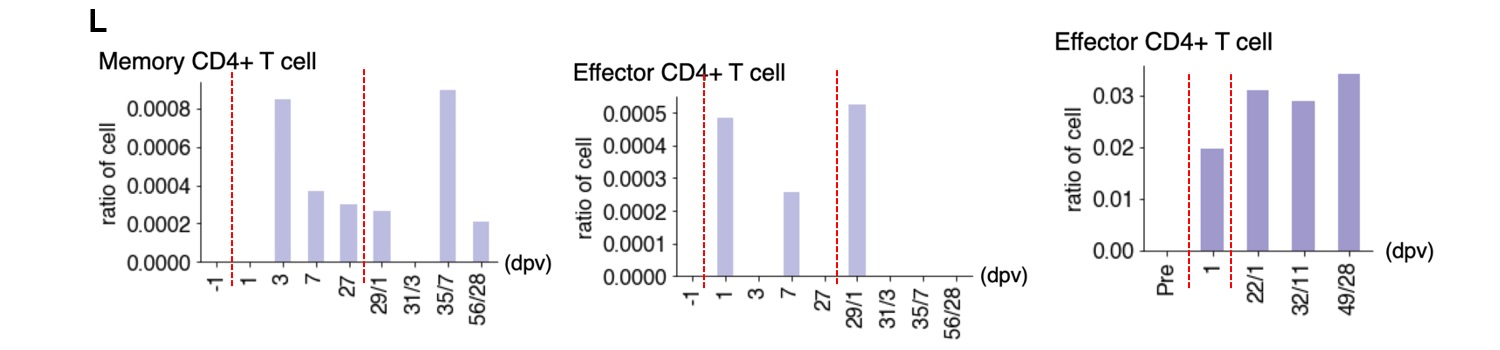
Figure 7. Perturbation of the immune cell gene expression profiles depending on SARS-CoV-2 vaccination.
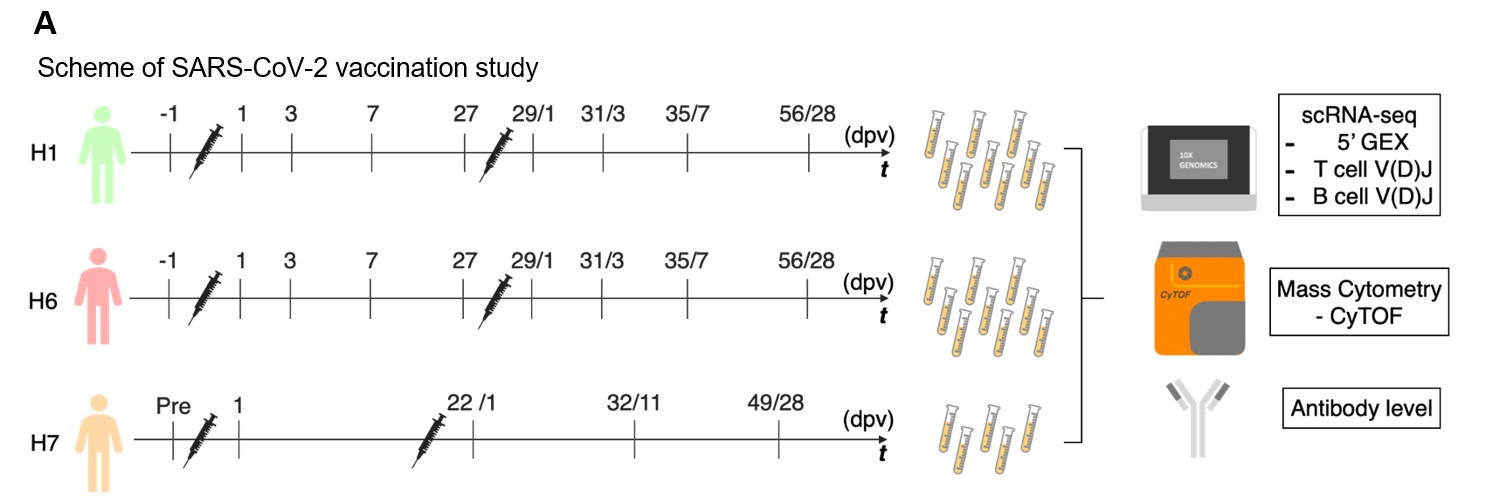
a, Scheme of the SARS-CoV-2 vaccination study. We collected blood samples of H1, H6 and H7 in pre-vaccination (one day before vaccination, -1dpv), post first vaccination and post second vaccination. We analyzed PBMCs transcriptome, V(D)J of BCR and TCR in single-cell level using 10x Genomics, proteomics in single-cell level using Fluidigm CyTOF and anti-SARS-CoV-2 virus antibody level. b,c Transition of anti-SARS-CoV-2 antibody levels. Barplot showing antibody level in each timepoint. x-axis shows day after first vaccination and y-axis shows level of IgG (AU/mL) (b) and IgM (AU/mL) (c) in in H1 (green, left), H2 (coral, middle) and H7 (orange, right). d-f, Barplot showing transition of cell components before and after SARS-CoV-2 vaccination based on scRNA-seq datasets of H1 (d), H6 (e) and H7 (f). g-i, Transition of T cell with unique clonotypes are shown in left, and overlapped clonotypes are shown in right. j-l, Barplot showing T cell components transition of H1 (j), H6 (k) and H7 (l). m-o, Expression level of activation marker of T cell with unique clonotype and overlapped clonotypes in CD8+ T cell (m,n,o) and CD4+ T cell (p,q,r). x-axis shows day after first vaccination and y-axis shows CD69 gene expression. s-x, Barplot showing ratio of T cell with specific TCR in SARS-CoV-2 vaccination in H1 (s,v), H6 (t,w), and H7 (u,x). x-axis shows day post vaccination and y-axis shows ratio of the specific T cell. Information of TCR clonotype is shown in the top of each graph.